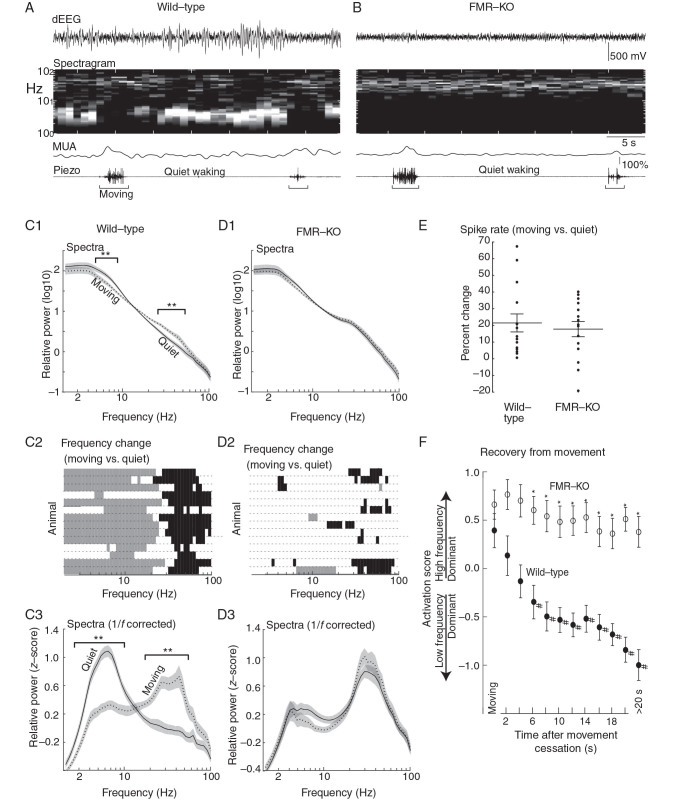
Figure 1.
Impaired movement-related cortical state regulation in FMR-KO rats. ( A ) Example depth electroencephalogram (dEEG) and associated time-spectrogram from superficial layers of a P22 wild-type rat. Below are associated multiunit activity (MUA) from all layers and piezo-derived movement signal. Note reduced 2–8 Hz signal and increased MUA during movement. ( B ) Example from a P22 FMR-KO. ( C ) P19–24 modulation by behavioral state of male wild-type rats ( n = 14). ( C1 ) Population mean spectra during movement and during quiet (waking) periods. Square brackets show frequencies with significant difference between conditions ( P < 0.01 permutation analysis). ( C2 ) Individual animal responses in rows. Gray bars show frequencies with significant negative modulation by movement; black bars significant positive modulation. ( C3 ) Population mean spectra in which the 1/f relationship has been removed and the spectra z -score normalized. Square brackets show frequencies with significant difference. ( D ) P19–24 modulation by behavioral state for male littermate FMR-KO rats ( n = 14). ( E ) Modulation of MUA by movement. ( F ) Time course of the shift between activated and inactivated states after cessation of movement. “Activation Score” is measured as mean 25–50 Hz relative power – mean 4–8 Hz relative power. >20 s means all times more than 20 s after movement. *Significant differences between groups, # significant difference from Moving timepoint in same group ( P < 0.01 by pair-wise analysis following mANOVA).

