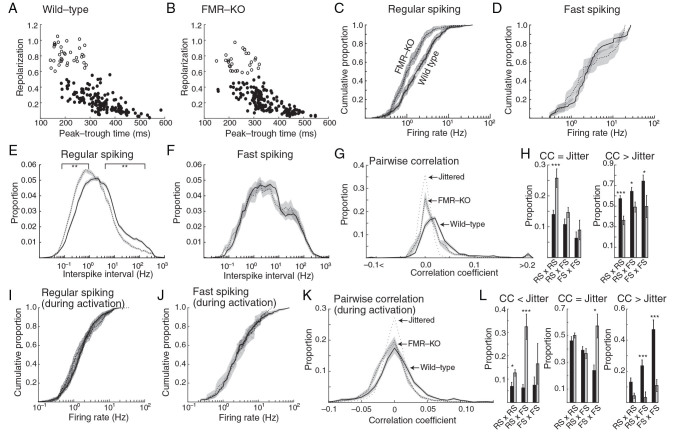
Figure 3.
Hyposynchrony and disrupted inhibitory neuron interactions in juvenile FMR-KO rats. Tetrode-based isolation of presumptive single units was used to quantify neuron behavior in juvenile wild-type and FMR-KO (P19-P24). ( A , B ) Plot of spike waveforms for 200 neurons of each genotype. Neurons were divided into 2 types based on peak-trough time and repolarization: presumed excitatory regular-spiking (filled circles), and presumed inhibitory Fast-spiking (open circles). ( C ) Cumulative distribution of neuron spike rates of regular-spiking neurons during all cortical states. Shaded regions show 95% confidence interval. ( D ) Firing rates of fast-spiking neurons. ( E ) Population mean of the instantaneous firing rate (interspike interval) distribution of regular-spiking neurons. Line segments show frequency points with significant difference ( P < 0.01 permutation test) between groups. ( F ) Population mean of instantaneous firing rate distribution for fast-spiking neurons. ( G ) Population mean of the distribution of pair-wise spike rate correlation coefficients during all cortical states. The correlation of jittered units (showing the expected distributions from random firing) is shown as a thin dotted line. ( H ) Population mean of the proportion of units that were not correlated (correlation coefficient [CC] within range of jittered spike distribution) (left) and for units that were correlated (CC higher than the range of the jittered spike distribution) (right). ( I ) Cumulative distribution of neuron firing rates for regular-spiking neurons during the activated state. ( J ) As in ( I ) for fast-spiking neurons. ( K ) As in ( G ) but limited to activated states. ( L ) As in ( H ) but limited to activated states. Leftmost chart shows proportion of neuron pairs that were anticorrelated (CC below range of jittered spike distribution). *** P < 0.001, ** P < 0.01, * P < 0.05.

