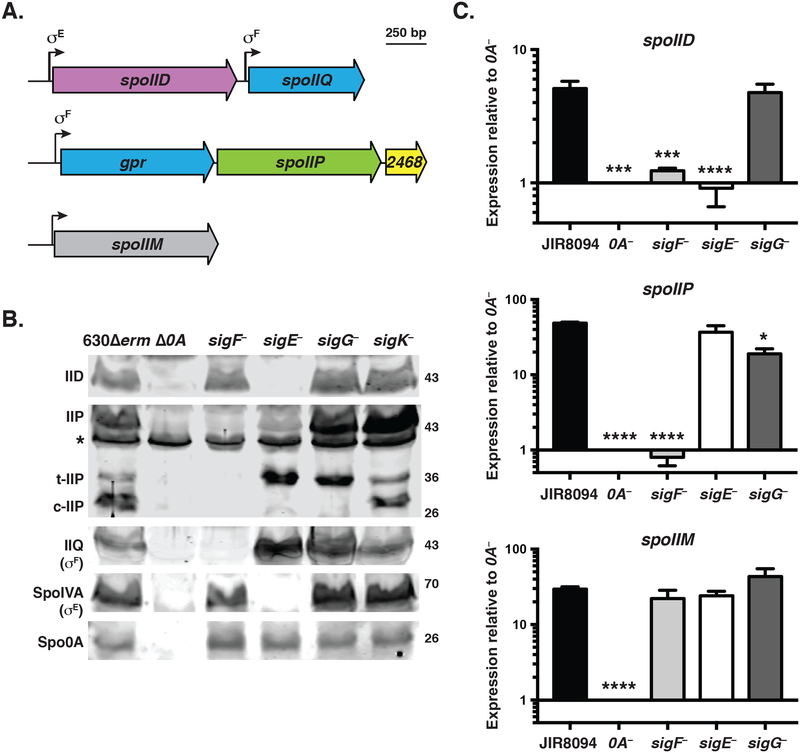
Fig. 1. Transcriptional regulation of spoIID, spoIIP, and spoIIM genes in C. difficile.
(A) Schematic of IID and IIP activities on peptidoglycan. Yellow hexagons (NAG) represent N-acetylglucosamine; blue hexagons (NAM) represent N-acetylmuramic acid, purple circles represent L-alanine, pink circles represent D-glutamic acid, grey circles represent m-2,6-diaminopimelic acid (DAP); green circles represent D-alanine; and the black line indicates cross-linking between DAP and D-ala residues. IIP has both endopeptidase and amidase activity (scissors), both of which are shown in the schematic. IID has lytic transglycoslase activity (pink triangles). (B) Schematic of spoIID (CD0126), spoIIP (CD2469), and spoIIM (CD1221) transcriptional units identified by RNA-Seq analyses (Fig. S1, (Fimlaid et al., 2013, Pishdadian et al., 2015)). Promoters are represented as bent arrows, and the sigma factor binding sites identified by Saujet et al. are shown above (Saujet et al., 2013). (C) qRT-PCR analyses of spoIID, spoIIP, and spoIIM transcription in JIR8094, spo0A::ermB (0A–), and sporulation sigma factor mutants. Transcript levels were normalized to the housekeeping gene, rpoB, using the standard curve method. The normalized transcript levels for each strain was compared to the normalized transcript level of spo0A–. Data represents the average of three independent biological replicates. Data were analyzed using a one-way ANOVA and Tukey’s test. (*, p < 0.05, ***, p < 0.005, ****, p < 0.0001). (D) Western blot analyses of IID and IIP in 630Δerm, Δ0A, and associated sporulation sigma factor mutants. While a clean deletion was made in spo0A, the sporulation sigma factor genes were disrupted using a Targetron insertion (Heap et al., 2007). The western blots shown are representative of the results of three independent biological replicates. Three separate isoforms were detected for IIP in wild type: full-length (IIP), truncated IIP (t-IIP), and cleaved IIP (c-IIP). The predicted MW of IIP is 38 kDa, and the MW of IIP lacking its signal peptide is 35 kDa. The asterisk denotes a non-specific protein recognized by the polyclonal anti-IIP antibodies. A faint cross-reacting band is also visible with the IID antibody. As controls for these analyses, western blotting was performed using anti-IIQ and anti-IVA antibodies, whose production depends on σF and σE, respectively. Spo0A (0A) was used as a proxy for measuring sporulation induction (Dembek et al., 2017, Putnam et al., 2013).

