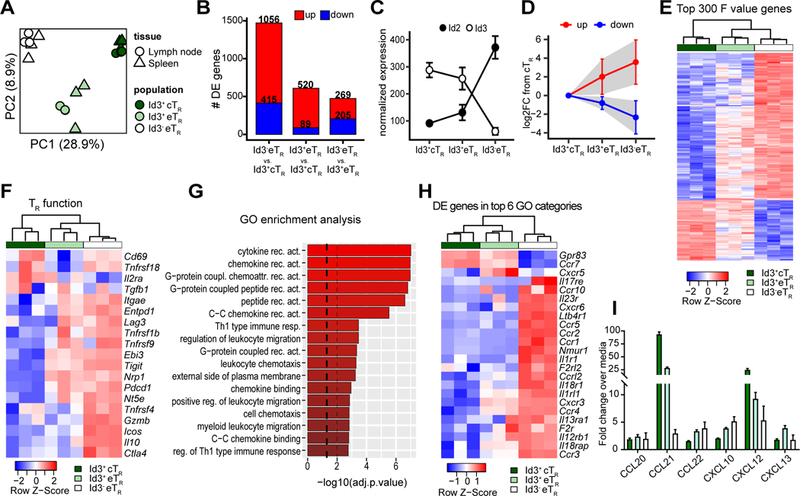
Figure 3: Transcriptional profiling highlights the stepwise differentiation of Id3- eTR.

A) PCA of RNA-seq data from LN and splenic Id3+ cTR, Id3+ eTR and Id3- eTR populations sorted from three individual mice. B) Bar graphs showing the number of differentially expressed genes (adj.p.value < 0.05 and log2FC >1) for each of the indicated pairwise comparisons. C) Graphical analysis of normalized transcript reads for Id2 or Id3 from RNA-seq data. D) The 300 most differentially expressed genes (determined by F value) were split into the upregulated (red) and downregulated (blue) fractions based expression in Id3- eTR vs Id3+ cTR. Graph shows the mean log2FC compared to Id3+ cTR for both eTR populations. Error bars and shaded area represent 1×SD. E) Heatmap and hierarchical clustering of splenic RNA-seq samples based on the 300 most variably expressed genes. F) Heatmap and hierarchical clustering of splenic RNA-seq samples based on TR signature genes identified in reference (8). G) GO term enrichment analysis for DE genes of Id3- eTR vs. Id3+ eTR. Dashed lines represent adjusted p values of 0.05 and 0.01. H) Heatmap and hierarchical clustering of splenic RNA-seq samples based on DE genes found in the top 6 GO functional categories enriched in the comparison of Id3+ and Id3- eTR. I) Graphical analysis of chemotaxis assay.
