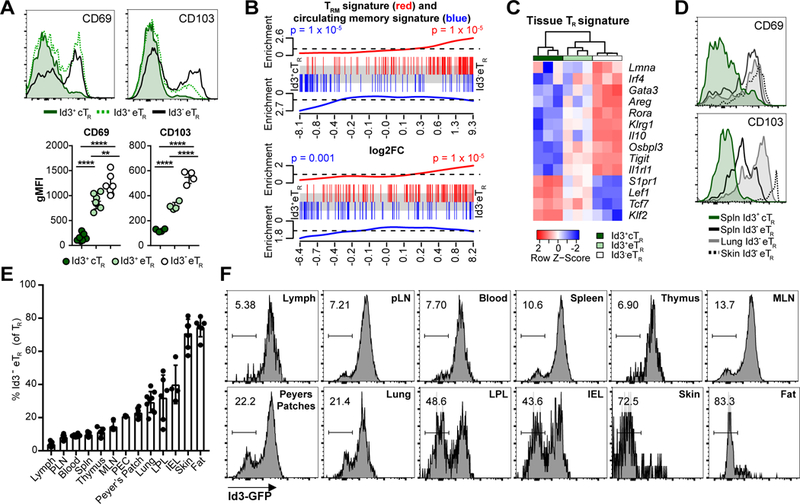
Figure 4: Id3- eTR are enriched and resident in non-lymphoid tissues.

A) Representative flow cytometry histograms and graphical analysis of expression of the CD69 and CD103 by gated splenic TR populations. B) Enrichment of CD8+ TRM (red) or circulating T cell (blue) gene sets along ranked lists of the indicated pairwise comparisons. C) Heatmap and hierarchical clustering of splenic RNA-seq samples based on ST2+ tissue TR associated genes. D) Representative flow cytometry plots of CD103 and CD69 expression by gated TCRβ+ CD4+ Foxp3+ TR in the indicated tissues. E) Graphical analysis of Id3- eTR frequency among total TR in various tissues. F) Representative histograms of GFP expression from various tissues of Id3-GFP x Foxp3-mRFP mice, gated on TCRβ+ CD4+ Foxp3+ TR.
