Figure 1.
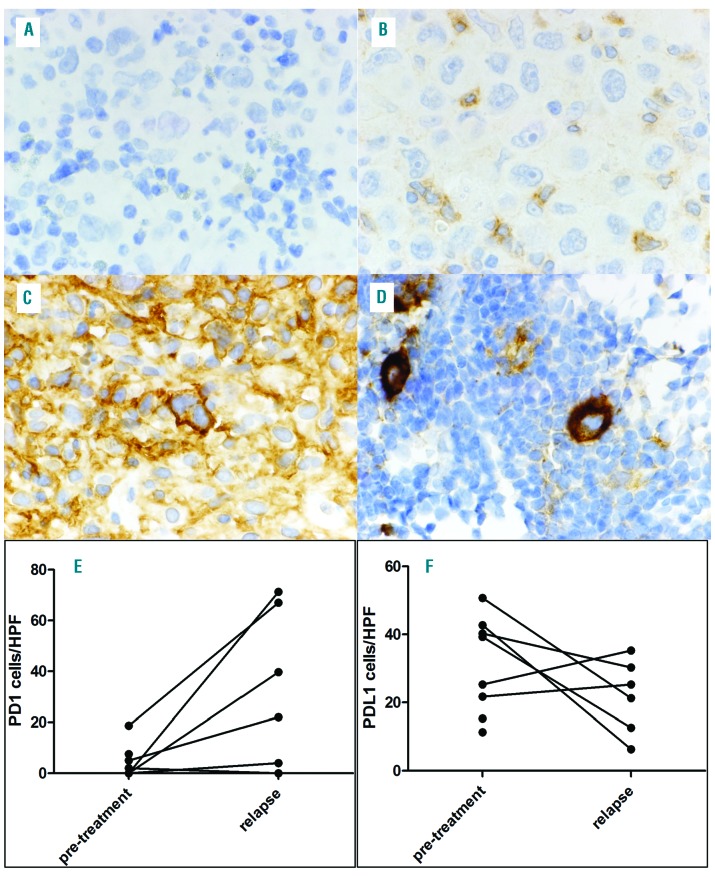
Staining of PD-1 positive T cells and PD-L1 positive macrophages. Staining for PD-1 in Patient 2 showing an increase in PD-1-positive T cells between pre-treatment (A) and relapse (B) biopsy in close proximity to Hodgkin and Reed Sternberg cells (HRSC). Patient 2 with a marked decline in PD-L1 positive macrophages between pre-treatment (C) and relapse (D) biopsy. HRSC are strongly positive for PD-L1 at both time points. (A-D, original magnification 1000×). Comparison of PD-1-positive T-cell (E) and PD-L1-positive macrophage (F) content as cells per high-power field (HPF). Biopsies of the same patient are connected with a line.

