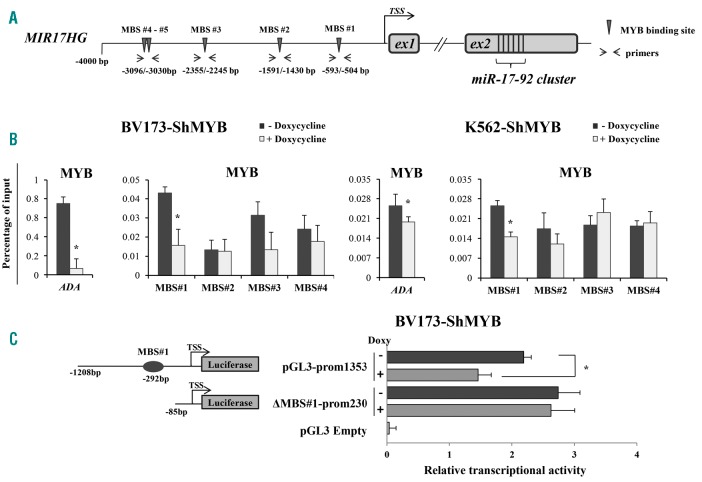
Figure 2.
MYB binding to the promoter of the miR-17-92 cluster. (A) Schematic representation of 4000 bp regulatory regions upstream of the MIR17HG promoter. A transcription start site (TSS) is indicated. Arrows indicate the promoter region amplified by the specific primer pair used for qPCR amplification of immunoprecipitated chromatin. (B) ChIP analysis of the MIR17HG promoter using the indicated MYB antibody in untreated (Not Treated; NT) or Doxycycline (Doxy)-treated BV173-ShMYB and K562-ShMYB cells. Results of qPCR are analyzed with the comparative Ct method. Values of each immunoprecipitated sample are expressed as percentage relative to their respective input and by subtracting the values obtained in the negative controls (no antibody). Error bars represent Standard Error of Mean (SEM) (n=3); P-values (*P≤0.05) were determined using Student t-test. (C) (Left panel) Schematic representation of the reporter plasmids containing the MYB binding site (MBS) #1 (pGL3–prom1353) or its deletion mutant without the MBS#1 (ΔMBS#1-prom230). (Right panel) Dual luciferase assay performed in untreated or Doxy-treated BV173-ShMYB cells transfected with the pGL3–prom1353 or the ΔMBS#1-prom230 plasmid. Promoter activity of each plasmid was determined 48 hours (h) after transfection. Luciferase activity values were normalized for transfection efficiency according to the activity of a co-transfected Renilla luciferase plasmid. Data are the average of three independent experiments performed in duplicate; error bars indicate Standard Error of Mean (*P≤0.05).

