Abstract
The homeobox gene HLXB9 encodes for the transcription factor HB9, which is essential for pancreatic as well as motor neuronal development. Beside its physiological expression pattern, aberrant HB9 expression has been observed in several neoplasias. Especially in infant translocation t(7;12) acute myeloid leukemia, aberrant HB9 expression is the only known molecular hallmark and is assumed to be a key factor in leukemic transformation. However, so far, only poor functional data exist addressing the oncogenic potential of HB9 or its influence on hematopoiesis. We investigated the influence of HB9 on cell proliferation and cell cycle in vitro, as well as on hematopoietic stem cell differentiation in vivo using murine and human model systems. In vitro, HB9 expression led to premature senescence in human HT1080 and murine NIH3T3 cells, providing for the first time evidence for an oncogenic potential of HB9. Onset of senescence was characterized by induction of the p53–p21 tumor suppressor network, resulting in growth arrest, accompanied by morphological transformation and expression of senescence-associated β-galactosidase. In vivo, HB9-transduced primary murine hematopoietic stem and progenitor cells underwent a profound differentiation arrest and accumulated at the megakaryocyte/erythrocyte progenitor stage. In line, gene expression analyses revealed de novo expression of erythropoiesis-related genes in human CD34+hematopoietic stem and progenitor cells upon HB9 expression. In summary, the novel findings of HB9-dependent premature senescence and myeloid-biased perturbed hematopoietic differentiation, for the first time shed light on the oncogenic properties of HB9 in translocation t(7;12) acute myeloid leukemia.
Introduction
Senescence serves as a tumor-suppressive mechanism and prevents proliferation of cells which have acquired an irreversible DNA-damage.1 Physiologically this results from continued telomere shortening during each round of replication and is therefore called replicative senescence. Onset of senescence is characterized by induction of tumor-suppressor networks such as p53–p21, followed by cell cycle arrest, morphological transformation, and increased β-galactosidase activity.1 Induction of senescence prior to the replication limit is termed premature senescence. In this case, DNA-damage is caused by genotoxic or replicative stress, for example due to mutagenic agents or oncogene expression.2 This was shown for strong oncogenes like RAS and MYC, which induce senescence in fibroblasts in the absence of other transforming mutations, so called oncogene-induced senescence.3,4
HLXB9, also known as MNX1 (motor neuron and pancreas homeobox 1), belongs to the ANTP class of homeobox genes.5 It is located on chromosome 7q36, spanning 5.8 kb and comprising 3 exons. The corresponding 401 aa protein is named HB9; this is highly conserved and functions as a transcription factor.6 Physiologically, HB9 is expressed during embryogenesis and is essential for the formation of the dorsal pancreatic bud and B-cell maturation.7–9 In addition, HB9 plays an important role in neuronal development by promoting motor neuron differentiation.10,11 A deregulated HB9 expression has been found in several tumor types. In poorly differentiated hepatocellular carcinomas, microarray analyses identified HB9 as the strongest differentially expressed gene compared to non-neoplastic hepatic controls.12 Also in transcriptome analysis of prostate cancer biopsies from African-Americans, HB9 was the most highly upregulated protein coding gene compared to matched benign tissues.13
In hematopoietic neoplasias, HB9 is aberrantly highly expressed in translocation t(7;12) acute myeloid leukemia (AML), which accounts for up to 30% of infant AML.14,15 Translocation t(7;12) AML patients have a very dismal prognosis, with a 3-year event-free survival of 0%, regardless of the treatment approach.15,16 Since its first description in 2000, aberrant HB9 expression remains the only known molecular hallmark of translocation t(7;12) AML,17,18 but only poor functional data exist regarding its oncogenic properties and how, if at all, aberrant HB9 expression influences hematopoiesis, thereby contributing to leukemogenesis. Early expression studies reported HB9 expression in healthy CD34+ hematopoietic stem and progenitor cells (HSPCs),19 but could not be validated by studies of our and other groups.15,20,21 Hence, a physiological function of HB9 in HSPCs remains a subject of debate. Morphologically, translocation t(7;12) AML blast cells are less differentiated (FAB subtype M0 or M2), accompanied by expression of stem cell markers like CD34 and CD117,15,22 indicating a very early differentiation block. Gene expression profiling of HB9+ blast cells revealed a modulation of cell-cell interaction and cell adhesion.22 In previous studies, we had used the AML cell line HL-60 for stable HB9 overexpression to identify potential HB9 target genes by combined ChIP-on-chip and expression analyses.21 As HL-60 cells represent an already transformed AML cell line model, harboring several genetic aberrations like loss of p53 and MYC replication,23 it is difficult to come to any conclusions about the oncogenic potential of HB9 and its influence on primary hematopoietic cells in vivo with respect to translocation t(7;12) leukemogenesis.
Thus, in our current study, we evaluated the oncogenic potential of HB9 by its effect on proliferation and cell cycle regulation. Furthermore, we performed for the first time in vivo hematopoietic reconstitution experiments to investigate the influence of HB9 expression on hematopoietic cell differentiation with regard to translocation t(7;12) AML.
Methods
Cell cycle analysis
3×10⁵ cells were washed twice with PBS and resuspended in hypotonic buffer solution, containing 0.1% Triton-X 100, 0.1% sodium-citrate and 50 μg/mL propidium iodide. After resuspension, cells were incubated for 10 minutes in the dark at room temperature and immediately analyzed by flow cytometry (FACSCalibur, BD Biosciences, Heidelberg, Germany).
β-galactosidase staining
Six days after transduction, cells were stained for β-galactosidase activity using the Senescence Cells Histochemical Staining Kit (Sigma-Aldrich, Taufkirchen, Germany) according to the manufacturer’s instructions. A total of 300 cells were counted for each replicate and the frequency of positive cells was determined. Images were taken using an Axiovert 200 microscope (Zeiss, Jena, Germany).
Bone marrow transplantation
Bone marrow cells were harvested from femurs and tibiae of 8-10-week old male C57BL/6 mice and Lineage+ cells were depleted using the Lineage Cell Depletion Kit (Miltenyi Biotec, Bergisch Gladbach, Germany). Lin− cells were cultured in Stemspan SFEM (Stemcell Technologies, Cologne, Germany), supplemented with 1% penicillin-streptomycin, 100 ng/mL SCF, 100 ng/mL FLT3L, 100 ng/mL TPO, 25 ng/mL IL6 and 25 ng/mL IL11 (PeproTech, Hamburg, Germany). Twenty-four hours (h) after isolation, Lin− cells were lentivirally transduced (MOI 50), together with hexa-dimethrine bromide (5 μg/mL; Sigma-Aldrich) on RetroNectin (Takara, Frankfurt, Germany) coated plates, and spinoculated at 1000 g for 2 h at 32°C. One day after transduction, Lin− cells were transplanted via tail-vein injection into myeloablative-irradiated 8-10-week old female B6.SJL-Ptprc Pepc/BoyJ mice.
Isolation of CD34+ cord blood cells
The use of primary human CD34+ cord blood cells for this study was approved by the ethics committee of the medical faculty of the Heinrich-Heine-University, Duesseldorf, and was carried out in accordance with the Declaration of Helsinki. Cord blood samples were obtained from healthy donors after informed consent (José Carreras Stem Cell Bank, University Hospital Duesseldorf, Germany) and mononuclear cells were enriched by density gradient centrifugation with Ficoll Paque Plus (GE Healthcare, Frankfurt, Germany). CD34+ cells were enriched using CD34 MicroBead Kit and MACS technology (Miltenyi Biotec) according to the manufacturer’s instructions and cultivated in X-Vivo 20 (Lonza, Cologne, Germany) supplemented with 100 ng/mL SCF, 100 ng/mL FLT3L, 100 ng/mL TPO and 20 ng/mL IL3 (Peprotech).
Statistical analysis
Statistical significance was determined from adequately powered sample sizes of similar variation using two-tailed unpaired Student t-tests and was defined as P≤0.05 (*), P≤0.01 (**) and P≤0.001 (***). Sample sizes are given in the figure legends.
Other methods
The details of other methods, including virus production, immunofluorescence, siRNA transfection, cell preparation and flow cytometric analysis, as well as western blot, PCR, quantitative Reverse Transcriptase-PCR and RNA-Seq-analysis are given in the Online Supplementary Appendix.
The RNA-Seq data generated in this study can be found with accession number GSE117060 in the NCBI GEO database.
Results
Aberrant HB9 expression induces premature senescence
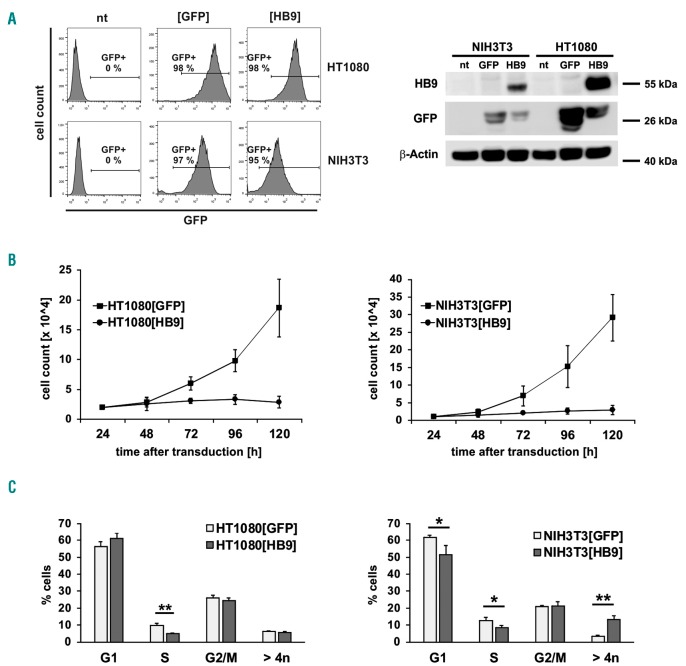
In order to investigate the influence of HB9 on cellular proliferation and cell cycle, human HT1080 and murine NIH3T3 cells were lentivirally transduced with HB9-GFP or GFP (Online Supplementary Figure S1) and subjected to downstream analysis. Cell models were selected due to high transduction efficiency, as well as a short doubling time, and have already been used in several studies regarding proliferation and cell cycle analysis.24–26 The transduction efficiency reached almost 100% in both models with a high transgene expression, whereas no endogenous HB9 was detectable (Figure 1A). While control vector-transduced cells ([GFP]) showed a normal exponential growth, HB9-transduced cells ([HB9]) arrested within 72 h after transduction (HT1080: P=0.01; NIH3T3: P=0.05) (Figure 1B). Cell-cycle analysis revealed a significant decrease of cells in the S-phase in HT1080[HB9] (9.6% vs. 4.9%; P=0.005), stalling the cells in G1- and G2-phase (Figure 1C). NIH3T3[HB9] corroborated a significant decrease of cells in the S-phase (12.7% vs. 8.5%; P=0.038). Furthermore, a significant decrease of cells in the G1-phase (61.6% vs.51.6%; P=0.037) and an increase of aneuploid cells (>4n; 3.4% vs. 13.3%; P=0.002) was observed (Figure 1C).
Figure 1.
Proliferation and cell cycle analysis of HB9-transduced HT1080 and NIH3T3 cells. (A) Flow cytometric analysis of GFP-expression was used to determine the transduction efficiency. HB9-expression was analyzed by western blot of non- (nt), control- (GFP) and HB9-vector-transduced NIH3T3 and HT1080 cells. (B) Proliferation study of HB9- or GFP-transduced HT1080 and NIH3T3 cells. Cells were seeded at 24 hours (h) after transduction and counted over a 4-day period (n=3). (C) Cell cycle analysis of HB9- or GFP-expressing cells 72 h after lentiviral transduction (n=3).
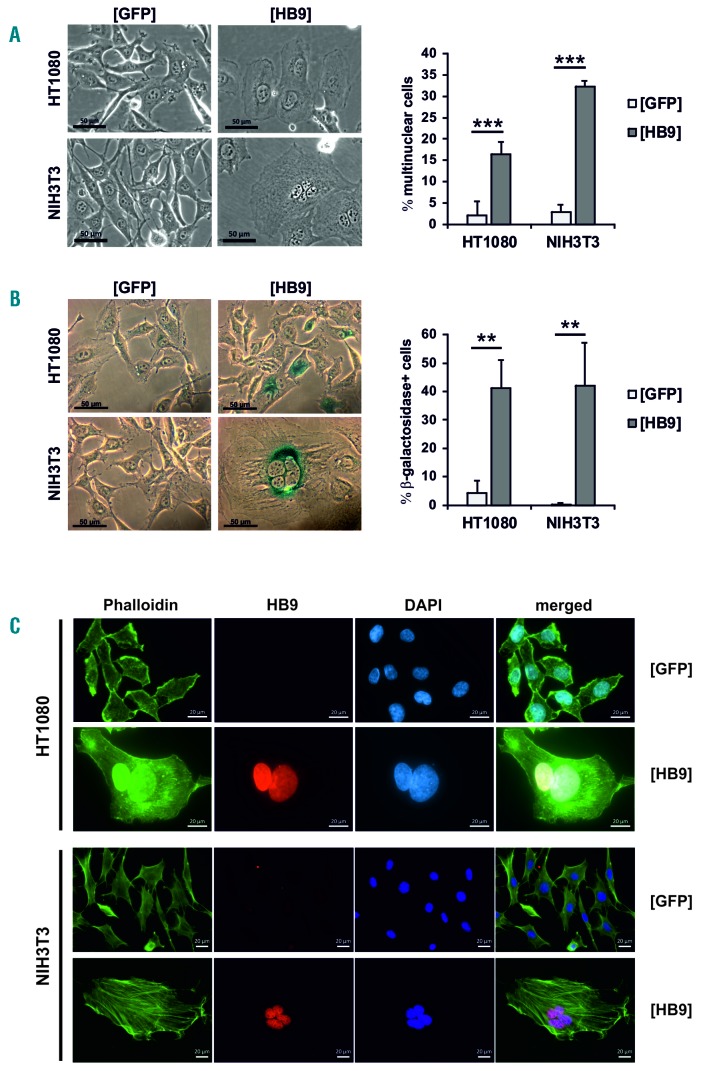
Contiguous with the growth arrest, HB9-transduced cells underwent morphological changes, becoming flattened, enlarged and multinuclear (Figure 2A). As these morphological properties were reminiscent of senescent cells, we assessed senescence-associated β-galactosidase activity (SA-β-gal).27 The frequency of SA-β-gal+ cells was significantly increased in HT1080[HB9] (10-fold; P≤0.01) and NIH3T3[HB9] (133-fold; P≤0.01), compared to control (Figure 2B). Immunofluorescence staining confirmed HB9 localization within the nucleus, which is essential for its function as a transcription factor (Figure 2C). Further, co-staining with phalloidin depicted an increase of cytoskeleton and presence of stress fibers as additional characteristics of senescent cells in HT1080[HB9] and NIH3T3[HB9].28 In addition, HT1080[HB9] displayed a senescence-associated nuclear actin accumulation.29
Figure 2.
Analysis of the morphology of HB9-transduced HT1080 and NIH3T3 cells. (A) Microscopic analysis regarding the morphology of HB9- and GFP-transduced cells (scale bar=50μm). 150 cells were counted from each cell line to determine the percentage of multinuclear cells (n=3). (B) SA-β-gal staining was performed seven days after transduction. 150 cells were counted each to determine the percentage of β-gal+ cells (n=3). (C) Immunofluorescence staining. F-actin was stained by Phalloidin (shown in green) to detect senescent cell characteristics, such as presence of stress fibers and nuclear actin accumulation. DNA was stained by DAPI (shown in blue). HB9 is shown in red (scale bar=20μm; shown is one representative experiment out of three).
HB9 activates the p53-p21 tumor suppressor network
The tumor suppressor p53 plays a prominent role in the G1/S checkpoint control and in the mediation of premature senescence via activation of the cyclin-dependent kinase inhibitor p21.4,30 Therefore, we investigated the p53/p21 status in the HB9 expressing cell line models.
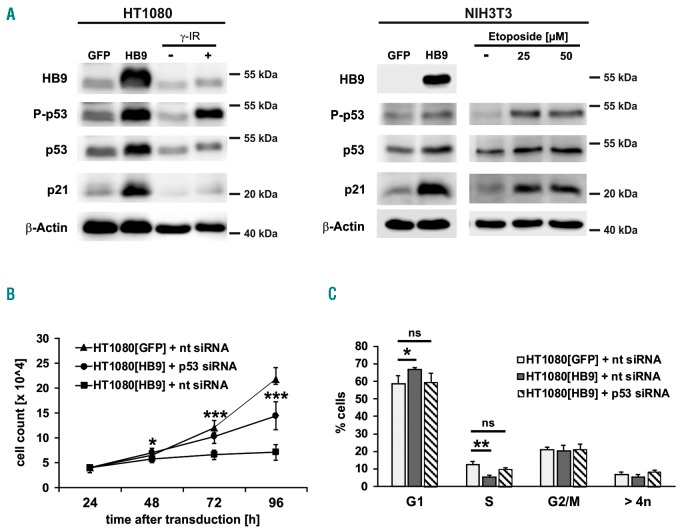
Immunoblotting revealed phosphorylation of p53 at serine 15 upon HB9 expression, indicating activation of the p53-signaling pathway in response to DNA-damage.31 As a result of phosphorylation, p53 accumulates, leading to induction of its downstream mediator p21 (Figure 3A).30,32 Gamma-irradiated HT1080 and Etoposide-treated NIH3T3 cells served as positive control for a DNA-damage dependent p53-pathway activation.31,33 We used a siRNA-mediated p53 knockdown model to determine whether p53 is essential for the HB9-dependent growth arrest. Therefore, HT1080 cells were transfected with p53 or non-targeting siRNA-pools prior to transduction and subjected to proliferation analysis. The siRNA mediated knockdown resulted in a distinct p53 protein reduction for 72 h (Online Supplementary Figure S2), correlating with a reduced pathway activation (Online Supplementary Figure S3). As expected, knockdown of p53 prevented the growth inhibitory effect caused by HB9, as p53-knockdown cells showed a significantly increased proliferation rate compared to non-targeting control (Figure 3B). In line, no significant reduction (P=0.1) of the S-phase was observed in HT1080[HB9] transfected with p53-siRNA compared to GFP-control (Figure 3C). These data confirm that the HB9-dependent growth arrest is mediated via activation of p53-signaling.
Figure 3.
Analysis of p53-pathway activation in HB9-transduced HT1080 and NIH3T3. (A) Western blot analysis of p53, phospho-p53 Ser15 (P-p53) and of its downstream effector p21 in HB9- or GFP-transduced HT1080 and NIH3T3 cells. γ-irradiated (HT1080) or Etoposide-treated (NIH3T3) cells serve as control for p53 pathway activation. Shown is one representative experiment out of three. (B) Proliferation and (C) cell cycle analysis of HB9-transduced HT1080, treated with non-targeting (nt) and p53-targeting siRNA, compared to GFP-transduced cells treated with non-targeting siRNA (n=3). ns: not significant.
Thus, with regard to onset of a tumor suppressor network, resulting in cell cycle arrest, morphological transformation and expression of SA-β-gal, HB9 induces premature senescence in both cell line models.
In general, gene expression, which triggers senescence, has the potential to initiate or promote carcinogenesis.34 The induction of premature senescence following oncogene expression is known as oncogene-induced senescence.2 While expression of these oncogenes in vitro results in growth inhibition, pre-malignant neoplasias arise in vivo.35 Thus, our next step was to investigate the oncogenic potential of HB9 together with its influence on hematopoietic differentiation in vivo.
HB9-expressing HSPCs undergo differentiation arrest and accumulate at the megakaryocyte/erythrocyte progenitor stage
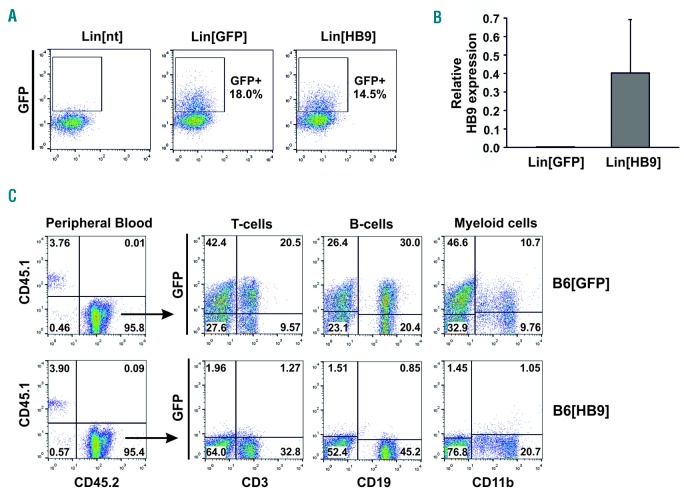
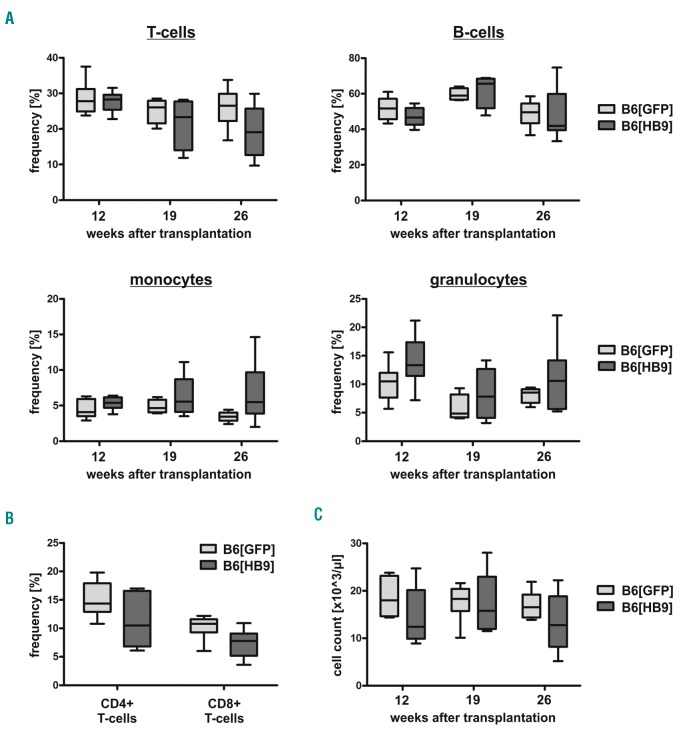
To this end, we developed a murine HB9+ transplantation model. Lineage− (Lin−) cells, obtained from CD45.2+ donor mice, were lentivirally transduced with HB9 or control vector and transplanted into myeloablative-irradiated CD45.1+ recipient mice. Transduction of Lin− HSPCs resulted in 15-20% GFP+ or HB9-GFP+ cells, respectively (Figure 4A), and comparable or even higher GFP expression levels were detected in Lin[HB9] compared to Lin[GFP] by qRT-PCR (Online Supplementary Figure S4A). We also confirmed co-expression of HB9 in Lin[HB9], and, as expected, no endogenous HB9 expression was detected in Lin[GFP] (Figure 4B and Online Supplementary Figure S4B). Twelve weeks after transplantation, peripheral blood cells of recipient mice were analyzed for GFP-expression. Flow cytometric analysis confirmed complete hematopoietic reconstitution by transplanted HSPCs, as more than 90% of the cells were positive for CD45.2 (Figure 4C). In Lin[GFP]-transplanted mice (B6[GFP]), we detected GFP+ T, B and myeloid cells (GFP+: 30.1–85.8% T cells, 20.7–69.8% B cells, 8.8–70.2% myeloid cells), whereas no distinct HB9-GFP+ cell population was present in any lineage of Lin[HB9]-transplanted mice (B6[HB9]) (Figure 4C). Using PCR-based analysis, we were able to confirm genomic integration and transcription of the expression cassettes in peripheral blood cells of B6[HB9] and B6[GFP] (Online Supplementary Figure S5). In line with flow cytometry, qRT-PCR showed a significantly decreased GFP-expression (13-fold; P=0.015) in B6[HB9] compared to B6[GFP] (Online Supplementary Figure S5B). Regarding cell frequencies, B6[HB9] mice showed an overall decrease in T cells (Figure 5A), valid for both CD4+ and CD8+ T cells (Figure 5B), while the frequency of B cells varied. Addressing the myeloid lineage, an increased frequency of monocytes and granulocytes was observed (Figure 5A). Overall blood cellularity was decreased in B6[HB9] regardless of lineage contribution (Figure 5C). Serial blood draws confirmed these observations during the entire monitoring period (6.5 months). To investigate whether a differentiation blockage is causative for reduced blood cellularity as well as absence of HB9-GFP+ mature blood cells, we performed comprehensive FACS analysis from HSCs to mature B cells, T cells, and myeloid cells.
Figure 4.
Transplantation of HB9-transduced hematopoietic stem and progenitor cells and monitoring of hematopoietic reconstitution. (A) Flow cytometric analysis of GFP expression in Lineage− cells, non-transduced (Lin[nt]), or transduced with HB9 (Lin[HB9]) or control vector (Lin[GFP]). Shown is one representative experiment. (B) Detection of HB9 expression by qRT-PCR in Lin[GFP] and Lin[HB9] (n=3). (C) Flow cytometric analysis of CD45.2 and GFP expression in peripheral blood cells of Lin[GFP]- (B6[GFP]) or Lin[HB9]-transplanted mice (B6[HB9]).
Figure 5.
Frequency of lymphoid and myeloid cell types in peripheral blood of B6[GFP] and B6[HB9]. (A) Flow cytometric analysis was used to determine the frequency of T cells (CD3+), B cells (CD19+), monocytes (CD11b+Gr-1—) and granulocytes (CD11b+Gr-1+) in peripheral blood cells of B6[GFP] and B6[HB9] 12, 19 and 26 weeks after transplantation (n=6). (B) Frequency of CD3+CD4+ and CD3+CD8+ T cells in peripheral blood cells of B6[GFP] and B6[HB9] 26 weeks after transplantation (n=6). (C) Leukocyte count/μL peripheral blood of B6[GFP] and B6[HB9] 12, 19 and 26 weeks after transplantation (n=6).
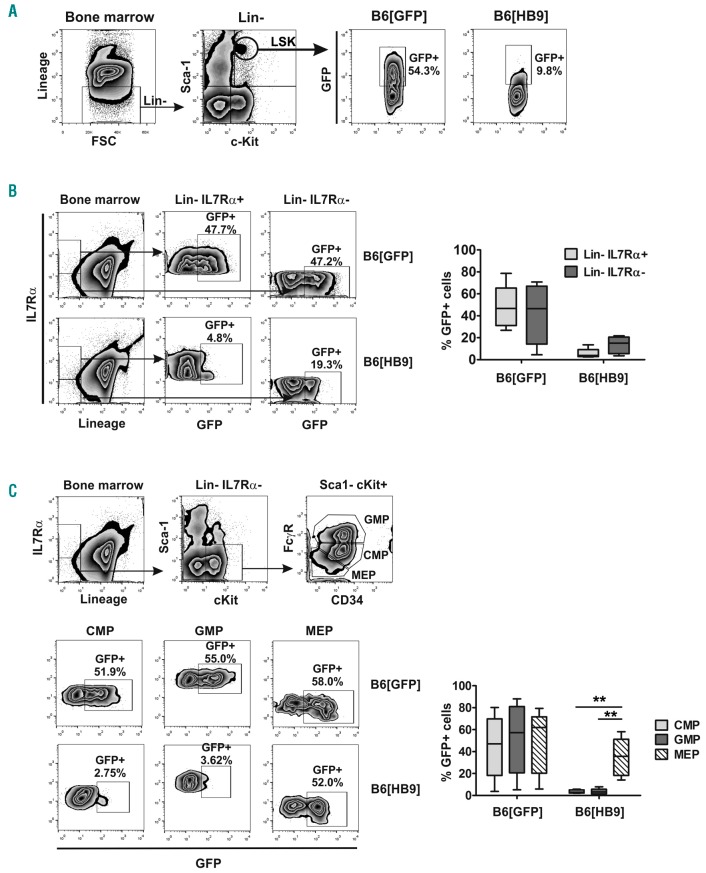
In contrast to the mature cell pool, HB9-GFP-expressing cells were detected within the Lin−Sca-1+c-Kit+ (LSK)/HSC compartment (Figure 6A). To evaluate the differentiation potential of HB9-expressing HSCs, Lin− cells were further analyzed regarding IL7Rα, which is expressed by lymphoid but not myeloid committed progenitors. HB9-GFP expression was decreased in lymphoid committed progenitors (Lin−IL7Rα+) compared to that in myeloid committed progenitors (Lin−IL7Rα−), while B6[GFP] showed comparable amounts of GFP+ cells in both progenitor populations (Figure 6B). Due to the enrichment of HB9-expressing cells in the myeloid progenitor subset, this compartment was further analyzed. Sub-gating of the myeloid progenitor population into common myeloid progenitors (CMP), megakaryocyte/erythrocyte progenitors (MEP) and granulocyte/macrophage progenitors (GMP) revealed that HB9-GFP-expressing cells contributed almost exclusively to the MEP subset as the amount of HB9-GFP+ MEP was significantly enriched compared to CMP and GMP (Figure 6C).
Figure 6.
Flow cytometric analysis of GFP expression in the hematopoietic stem and progenitor cell compartment. (A) Lineage−c-Kit+Sca-1+ (LSK) hematopoietic stem cells were analyzed for GFP expression. Shown is one representative experiment. (B) Lymphoid (Lin−IL7Rα+) and myeloid (Lin−IL7Rα−) progenitors were analyzed for GFP expression and the percentage of GFP+ cells was determined for each compartment (n=5). (C) Flow cytometric analysis of GFP expression in the myeloid progenitor compartment, regarding MEP (Lin− IL7Rα− c-Kit+ Sca-1− FcγRlow CD34−), CMP (Lin− IL7Rα− c-Kit+ Sca-1− FcγRlow CD34+) and GMP (Lin− IL7Rα− c-Kit+ Sca-1− FcγRhigh CD34+) (n=5).
In line with peripheral blood, total white blood cell number of bone marrow and thus CMP, GMP and MEP was decreased in B6[HB9] compared to B6[GFP], but without affecting cell frequencies (Online Supplementary Figure S6).
Analysis of terminal MEP maturation was not applicable, as erythrocytes as well as thrombocytes are anuclear cell types and therefore do not carry the transgene. We further assessed the differentiation potential of HB9-GFP+ GMP cells, together with the frequency of the myeloid cell types originating from this. According to peripheral blood analysis, no distinct HB9-GFP+ cell population was detectable within the granulocyte and the monocyte/macrophage population in the bone marrow or spleen of B6[HB9] compared to B6[GFP] (Online Supplementary Figures S7-S9 and S11A-C). The frequency of macrophages/monocytes was slightly increased in B6[HB9] compared to B6[GFP], which is congruent to peripheral blood analysis, while, in contrast, the frequency of granulocytes was comparable (Online Supplementary Figure S12A and B).
With respect to lymphoid differentiation we assessed HB9-GFP expression as well as frequency of immature and mature B cells and T cells. While at the immature B220+CD19+CD93+ B-cell stage a low frequency of HB9-GFP+ cells was still detectable, no distinct HB9-GFP+ cell population was identified within the more mature B220+CD19+CD93− B-cell population in bone marrow, or within mature B cells of the spleen and peripheral blood (Online Supplementary Figure S7-S9 and S11D and E). Furthermore, B6[HB9] mice showed an overall increased frequency of immature CD93+ and a decreased frequency of more mature CD93− B cells in bone marrow compared to B6[GFP], but without affecting B-cell frequency in the periphery (Online Supplementary Figure S12C).
In contrast to immature B cells, no HB9-GFP+ cells were detected within immature CD4+CD8+ thymocytes (Online Supplementary Figures S10 and S11F). Congruent to the other lineages, no distinct HB9-GFP+ cell population was found within the mature T-cell compartment of bone marrow, spleen or peripheral blood (Online Supplementary Figure S7-S9 and S11G). In line with our results obtained from peripheral blood, the frequency of CD8+ T cells was slightly decreased in bone marrow and spleen of B6[HB9] compared to B6[GFP], while the frequency of CD4+ T cells was comparable (Online Supplementary Figure S12D). In summary, HB9+ HSCs showed an impaired differentiation capacity, resulting in an overall differentiation blockage, leading to reduced bone marrow as well as peripheral blood cellularity and accumulation of HB9+ cells at the MEP stage.
HB9 triggers expression of erythropoiesis-related genes and leads to decreased clonogenic potential in HSPCs
To further analyze the influence of HB9 on hematopoietic cells, regarding gene expression as well as clonogenicity, a highly purified population of transduced cells is mandatory. Thus, these experiments were performed with primary human CD34+ HSPCs, as these cells display a better GFP signal-to-noise ratio compared to their murine counterpart, allowing GFP+ cell FACS-sort upon transduction.
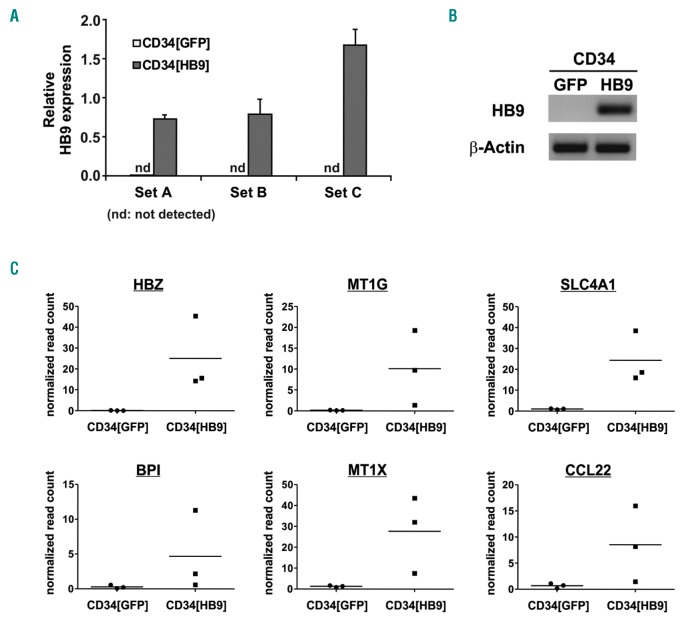
CD34[HB9] cells displayed transgene expression levels (Figure 7A) comparable to those in translocation t(7;12) AML blast cells,22 and no endogenous HB9 expression was detectable (Figure 7B).
Figure 7.
De novo gene expression in human CD34+ HSPCs upon HB9 transduction. (A) qRT-PCR analysis of HB9 expression, normalized to β-Actin, in cord blood derived CD34+ cells, transduced with GFP (CD34[GFP]) or HB9-GFP (CD34[HB9]). (B) Gel electrophoretic analysis of the qRT-PCR products. (C) De novo expressed genes in CD34[HB9] compared to CD34[GFP]; normalized read counts of three independent RNA-Seq experiments are depicted.
Genome-wide expression profiling revealed 117 genes, which were significantly differentially expressed (P≤0.05, FC≥1.8) in CD34[HB9] compared to CD34[GFP] (Online Supplementary Table S1 and Online Supplementary Figure S13). The gene with the highest fold change was HB9/MNX1, confirming transgene expression. Six genes were de novo expressed in CD34[HB9] compared to CD34[GFP] (Figure 7C), of which hemoglobin subunit zeta (HBZ), as well as solute carrier family 4 member 1 (SLC4A1), are restricted to the erythroid lineage, thereby confirming the HB9-dependent erythroid-biased differentiation observed in vivo. HBZ is an embryonic α-like globin gene, which is expressed in primitive erythroid cells. As hemoglobin is a tetramer of 2 α-like globin polypeptide chains and 2 β-like globin chains, also the embryonic β-like globin gene HBE1 was significantly upregulated (4.6-fold; P=0.019).
SLC4A1 is part of the anion exchanger family and is expressed in the erythrocyte plasma membrane, where it functions as a chloride/bicarbonate exchanger.
Thus, HB9 expression in CD34+ HSPCs initiates de novo expression of genes related to erythropoiesis, which is in line with the differentiation bias towards the megakaryocytic/erythroid cell lineage observed in vivo.
The computational gene set enrichment analysis software was used to statistically determine altered pathways related to HB9 expression associated with biological process-related gene ontology terms. Among the positive enriched biological processes, mitosis-related processes showed the strongest enrichment, while, in contrast, cytoskeleton organization-related processes showed the strongest negative enrichment (Online Supplementary Table S2 and Online Supplementary Figure S14). This phenotype resembles our observations made in vitro, where HB9 led to cell cycle arrest and multinuclearity as a consequence of senescence-response.
With regard to clonogenic potential, HB9-transduced CD34+ HSPCs showed a decreased clonogenic capacity compared to GFP-transduced cells (Online Supplementary Figure S15), corresponding to reduced cellularity in bone marrow (Online Supplementary Figure S6A) and peripheral blood (Figure 5C) of B6[HB9] mice.
Discussion
The homeobox gene HB9 is expressed during early embryonic development, being essential for pancreatic as well as motor neuronal differentiation.7–11 Aberrant HB9 expression has been detected in distinct tumor entities; especially in translocation t(7;12) AML it is assumed to be a key factor in leukemic transformation.15,18 However, up to now only poor functional studies exist addressing its oncogenic potential or its influence on hematopoiesis. We evaluated the oncogenic potential of HB9 regarding its influence on proliferation and cell cycle using a model of human HT1080 and murine NIH3T3 cells. In both cell-line models HB9-expression led to growth arrest within 72 h after transduction, mediated via the p53-p21 signaling axis. In line with this, siRNA-mediated p53-knockdown abolished the HB9-dependent growth inhibitory effect. Regarding cell cycle analysis, HT1080[HB9] showed a significant decrease in cells at the S-phase, stalling the cells at G1/G2-phase of the cell cycle. NIH3T3[HB9] corroborated that effect, and in addition exhibited a decrease in cells in the G1-phase and an increase in aneuploid cells, which can be explained as a dose-dependent effect, as NIH3T3 showed lower HB9 expression levels upon transduction compared to HT1080. This leads to less activation of p53-signaling, resulting in an incomplete G1/G2 arrest, so that NIH3T3[HB9] cells have the chance to re-enter the cell cycle, irrespective of an inappropriate replication, leading to an increase of aneuploid cells (> 4n), while there is a decrease in diploid cells at G1- and S-phase. Besides onset of a tumor-suppressor network, resulting in growth arrest, HB9-expressing cells exhibited typical morphological changes, becoming flattened, enlarged and multinuclear, as well as expression of SA-β-gal, thus fulfilling all main criteria of senescence.1
Cellular senescence is initiated in response to replicative stress, resulting from irreversible DNA damage, and can be differentiated into replicative senescence and premature senescence. Induction of premature senescence has been shown for many potent oncogenes, such as RAS, RAF, MEK and BRAF.4,36–38 In contrast to replicative senescence, oncogene-induced premature senescence occurs independently of telomer attrition, as a result of a strong mitogenic signal, which leads to an inappropriate replication of the DNA during the S-phase of the cell cycle and thus activation of DNA damage response.2 In line with this, HB9 triggered a DNA damage response in HT1080 and NIH3T3, indicated by phosphorylation of p53 at Ser15, as this specific phosphorylation site is a target for the DNA-damage kinases ATM and ATR.31,39 Thus HB9 expression induces DNA damage, which in turn activates p53-signaling as part of the DNA damage response. Furthermore, HB9-dependent replicative stress led to an increase in aneuploid cells in NIH3T3[HB9], which has already been shown for MYC oncogene.3 This was further validated in HB9-transduced CD34+ HSPCs: RNA-Seq analyses revealed a positive enrichment of biological processes related to DNA/RNA processing, as well as cell cycle and mitosis, and a negative enrichment of processes related to post-translational phosphorylation and intracellular signaling (Online Supplementary Table S2 and Online Supplementary Figure S16), which correlates to the replicative stress-dependent expression profile of MYC-driven lymphoma.40
Oncogenes, which induce premature senescence in vitro, are known to cause pre-malignant cell populations in vivo.35 This was shown for murine lung adenomas (RASV12), T-cell lymphomas (RASV12), prostate tumors (PTEN), as well as human benign melanocytic naevi (BRAFE600).38,41–43
With respect to translocation t(7;12) leukemogenesis, we set up a murine bone marrow transplantation model to investigate whether ectopic HB9-expression affects hematopoietic cell differentiation in vivo. Therefore, murine HSPCs were transduced with either HB9-GFP or GFP vector and transplanted into myeloablative irradiated recipient mice. HB9-transduction of Lin− HSPCs yielded expression levels comparable to that of translocation t(7;12) AML blast cells.22 Similar to human HSPCs, no endogenous HB9-expression was detectable in murine Lin− HSPCs.15,20,21 In vivo, HB9-expressing HSPCs underwent an overall differentiation arrest, as no HB9-GFP+ cells were detected within the mature B-, T- and myeloid-cell pool of recipient mice. Analysis of the HSPC compartment revealed an early blockage of the lymphoid lineage, while HB9-expressing HSPCs showed a strong myeloid lineage commitment. Within the myeloid progenitor population HB9-expressing cells were significantly enriched in the MEP, compared to the CMP and GMP compartment, thus revealing proliferation of HB9+ cells arrested at the MEP stage. Instead a differentiation blockage without proliferation would have resulted in comparable frequencies of GMP and MEP, whereas a megakaryocytic- and/or erythroid-biased differentiation would have resulted in comparable frequencies of CMP and MEP.
A myeloid-biased differentiation in combination with a diminished potential of lymphoid differentiation is associated with an aged hematopoietic system. This is assumed to result from aged HSCs, which show an impaired lymphoid differentiation capacity, while the myeloid differentiation capacity is maintained or even increased.44,45 Consistently, the incidence of myeloid malignancies increases with age. Recent studies highlight not only a myeloid, but in particular a megakaryocytic/erythroid bias in aged human and murine HSCs46 directly correlating to our results of a megakaryocytic/erythroid-biased differentiation and de novo expression of erythropoiesis-related genes in HB9+ HSPCs. Furthermore, the in vivo experiments have shown that the impaired differentiation capacity of HB9+ HSCs results in a decreased bone marrow and peripheral blood cellularity throughout the entire monitoring period. This is in line with our findings of HB9-dependent reduced clonogenicity in human CD34+ HSPCs, and further strengthens the assumption that HB9 induces senescence in hematopoietic cells. Onset of HB9-dependent senescence in hematopoietic cells is further supported by RNA-Seq data of CD34+ HSPCs. A strong positive enrichment of mitosis-related processes, together with a contradictory negative enrichment of cytoskeleton organization-related processes, reflects the senescence-associated multinuclear phenotype observed in the cell-line models, at molecular basis in CD34+ HSPCs.
With regard to translocation t(7;12) AML, our data may suggest that HB9-expression dictates the development of exclusively myeloid leukemia in translocation t(7;12)-positive AML patients.15 Although most translocation t(7;12) AML blast cells show a very undifferentiated state, some are defined as erythroblastic17,47 as well as megakaryoblastic leukemia,48,49 correlating to the megakaryocytic/erythroid-biased differentiation due to HB9 expression.
With regard to leukemogenesis, secondary genetic alterations are necessary, as sole HB9-expression did not result in complete transformation and progression to AML.
Based on our in vitro results, HB9 expression led to an increase in aneuploid cells, which is correlated to genetic instability. Thus, via induction of genetic instability, HB9 may increase the chance for secondary genetic alterations, which are necessary for complete cellular transformation. Initial screening studies using a panel of frequently mutated genes in AML (NPM1, CEPBA, MLL, WT1, FLT3, N-RAS, K-RAS, PTPN11 and KIT) did not succeed in identifying secondary recurrent genetic alterations in translocation t(7;12) AML.50 Thus, whole exome or whole genome analysis is necessary to identify additional relevant mutations in translocation t(7;12) AML.
In summary, the induction of premature senescence, together with perturbed hematopoietic differentiation, for the first time, sheds light on the oncogenic properties of HB9 in translocation t(7;12) AML. This will help us to find novel approaches for the treatment of fatal translocation t(7;12) AML, especially because resistance to therapy is a hallmark of this AML subtype.
Supplementary Material
Acknowledgments
We are indebted to all members of our group for useful discussions and critical reading of the manuscript. We thank Silke Furlan for excellent technical support.
Footnotes
Check the online version for the most updated information on this article, online supplements, and information on authorship & disclosures: www.haematologica.org/content/104/1/35
Funding
JH has been supported by the German Cancer Aid (110997), the German José Carreras Leukemia Foundation (DJCLS 02R/2016), the Deutsche Kinderkrebsstiftung (DKS 2016.17) and the “Forschungskommission” of the medical faculty of Heinrich-Heine-University.
References
- 1.Kuilman T, Michaloglou C, Mooi WJ, Peeper DS. The essence of senescence. Genes Dev. 2010;24(22):2463–2479. [DOI] [PMC free article] [PubMed] [Google Scholar]
- 2.Courtois-Cox S, Jones SL, Cichowski K. Many roads lead to oncogene-induced senescence. Oncogene. 2008;27(20):2801–2809. [DOI] [PubMed] [Google Scholar]
- 3.Felsher DW, Zetterberg A, Zhu J, Tlsty T, Bishop JM. Overexpression of MYC causes p53-dependent G2 arrest of normal fibroblasts. Proc Natl Acad Sci USA. 2000; 97(19):10544–10548. [DOI] [PMC free article] [PubMed] [Google Scholar]
- 4.Serrano M, Lin AW, McCurrach ME, Beach D, Lowe SW. Oncogenic ras provokes premature cell senescence associated with accumulation of p53 and p16INK4a. Cell. 1997;88(5):593–602. [DOI] [PubMed] [Google Scholar]
- 5.Holland PW, Booth HA, Bruford EA. Classification and nomenclature of all human homeobox genes. BMC Biol. 2007; 5:47. [DOI] [PMC free article] [PubMed] [Google Scholar]
- 6.Harrison KA, Druey KM, Deguchi Y, Tuscano JM, Kehrl JH. A novel human homeobox gene distantly related to proboscipedia is expressed in lymphoid and pancreatic tissues. J Biol Chem. 1994; 269(31):19968–19975. [PubMed] [Google Scholar]
- 7.Dalgin G, Ward AB, Hao le T, Beattie CE, Nechiporuk A, Prince VE. Zebrafish mnx1 controls cell fate choice in the developing endocrine pancreas. Development. 2011; 138(21):4597–4608. [DOI] [PMC free article] [PubMed] [Google Scholar]
- 8.Harrison KA, Thaler J, Pfaff SL, Gu H, Kehrl JH. Pancreas dorsal lobe agenesis and abnormal islets of Langerhans in Hlxb9-deficient mice. Nat Genet. 1999;23(1):71–75. [DOI] [PubMed] [Google Scholar]
- 9.Li H, Arber S, Jessell TM, Edlund H. Selective agenesis of the dorsal pancreas in mice lacking homeobox gene Hlxb9. Nat Genet. 1999;23(1):67–70. [DOI] [PubMed] [Google Scholar]
- 10.Arber S, Han B, Mendelsohn M, Smith M, Jessell TM, Sockanathan S. Requirement for the homeobox gene Hb9 in the consolidation of motor neuron identity. Neuron. 1999;23(4):659–674. [DOI] [PubMed] [Google Scholar]
- 11.Thaler J, Harrison K, Sharma K, Lettieri K, Kehrl J, Pfaff SL. Active suppression of interneuron programs within developing motor neurons revealed by analysis of homeodomain factor HB9. Neuron. 1999; 23(4):675–687. [DOI] [PubMed] [Google Scholar]
- 12.Wilkens L, Jaggi R, Hammer C, Inderbitzin D, Giger O, von Neuhoff N. The homeobox gene HLXB9 is upregulated in a morphological subset of poorly differentiated hepatocellular carcinoma. Virchows Arch. 2011;458(6):697–708. [DOI] [PubMed] [Google Scholar]
- 13.Zhang L, Wang J, Wang Y, et al. MNX1 Is Oncogenically Upregulated in African-American Prostate Cancer. Cancer Res. 2016;76(21):6290–6298. [DOI] [PMC free article] [PubMed] [Google Scholar]
- 14.Masetti R, Vendemini F, Zama D, Biagi C, Pession A, Locatelli F. Acute myeloid leukemia in infants: biology and treatment. Front Pediatr. 2015;3:37. [DOI] [PMC free article] [PubMed] [Google Scholar]
- 15.von Bergh AR, van Drunen E, van Wering ER, et al. High incidence of t(7;12)(q36;p13) in infant AML but not in infant ALL, with a dismal outcome and ectopic expression of HLXB9. Genes Chromosomes Cancer. 2006;45(8):731–739. [DOI] [PubMed] [Google Scholar]
- 16.Beverloo HB, Panagopoulos I, Isaksson M, et al. Fusion of the homeobox gene HLXB9 and the ETV6 gene in infant acute myeloid leukemias with the t(7;12)(q36;p13). Cancer Res. 2001;61(14):5374–5377. [PubMed] [Google Scholar]
- 17.Tosi S, Harbott J, Teigler-Schlegel A, et al. t(7;12)(q36;p13), a new recurrent translocation involving ETV6 in infant leukemia. Genes Chromosomes Cancer. 2000; 29(4):325–332. [DOI] [PubMed] [Google Scholar]
- 18.Tosi S, Mostafa Kamel Y, Owoka T, Federico C, Truong TH, Saccone S. Paediatric acute myeloid leukaemia with the t(7;12)(q36;p13) rearrangement: a review of the biological and clinical management aspects. Biomark Res. 2015;3:21. [DOI] [PMC free article] [PubMed] [Google Scholar]
- 19.Deguchi Y, Kehrl JH. Selective expression of two homeobox genes in CD34-positive cells from human bone marrow. Blood. 1991;78(2):323–328. [PubMed] [Google Scholar]
- 20.Nagel S, Kaufmann M, Scherr M, Drexler HG, MacLeod RA. Activation of HLXB9 by juxtaposition with MYB via formation of t(6;7)(q23;q36) in an AML-M4 cell line (GDM-1). Genes Chromosomes Cancer. 2005;42(2):170–178. [DOI] [PubMed] [Google Scholar]
- 21.Wildenhain S, Ingenhag D, Ruckert C, et al. Homeobox protein HB9 binds to the prostaglandin E receptor 2 promoter and inhibits intracellular cAMP mobilization in leukemic cells. J Biol Chem. 2012; 287(48):40703–40712. [DOI] [PMC free article] [PubMed] [Google Scholar]
- 22.Wildenhain S, Ruckert C, Rottgers S, et al. Expression of cell-cell interacting genes distinguishes HLXB9/TEL from MLL-positive childhood acute myeloid leukemia. Leukemia. 2010;24(9):1657–1660. [DOI] [PubMed] [Google Scholar]
- 23.Dalton WT, Jr, Ahearn MJ, McCredie KB, Freireich EJ, Stass SA, Trujillo JM. HL-60 cell line was derived from a patient with FAB-M2 and not FAB-M3. Blood. 1988;71(1):242–247. [PubMed] [Google Scholar]
- 24.Byun HS, Cho EW, Kim JS, et al. Thioredoxin overexpression in HT-1080 cells induced cellular senescence and sensitization to gamma radiation. FEBS letters. 2005;579(19):4055–4062. [DOI] [PubMed] [Google Scholar]
- 25.Hackenbeck T, Knaup KX, Schietke R, et al. HIF-1 or HIF-2 induction is sufficient to achieve cell cycle arrest in NIH3T3 mouse fibroblasts independent from hypoxia. Cell Cycle. 2009;8(9):1386–1395. [DOI] [PubMed] [Google Scholar]
- 26.Rao W, Xie G, Zhang Y, et al. OVA66, a tumor associated protein, induces oncogenic transformation of NIH3T3 cells. PloS One. 2014;9(3):e85705. [DOI] [PMC free article] [PubMed] [Google Scholar]
- 27.Dimri GP, Lee X, Basile G, et al. A biomarker that identifies senescent human cells in culture and in aging skin in vivo. Proc Natl Acad Sci USA. 1995;92(20):9363–9367. [DOI] [PMC free article] [PubMed] [Google Scholar]
- 28.Nishio K, Inoue A. Senescence-associated alterations of cytoskeleton: extraordinary production of vimentin that anchors cytoplasmic p53 in senescent human fibroblasts. Histochem Cell Biol. 2005;123(3):263–273. [DOI] [PubMed] [Google Scholar]
- 29.Kwak IH, Kim HS, Choi OR, Ryu MS, Lim IK. Nuclear accumulation of globular actin as a cellular senescence marker. Cancer Res. 2004;64(2):572–580. [DOI] [PubMed] [Google Scholar]
- 30.Jackson JG, Pereira-Smith OM. p53 is preferentially recruited to the promoters of growth arrest genes p21 and GADD45 during replicative senescence of normal human fibroblasts. Cancer Res. 2006;66(17):8356–8360. [DOI] [PubMed] [Google Scholar]
- 31.Shieh SY, Ikeda M, Taya Y, Prives C. DNA damage-induced phosphorylation of p53 alleviates inhibition by MDM2. Cell. 1997;91(3):325–334. [DOI] [PubMed] [Google Scholar]
- 32.Harper JW, Adami GR, Wei N, Keyomarsi K, Elledge SJ. The p21 Cdk-interacting protein Cip1 is a potent inhibitor of G1 cyclin-dependent kinases. Cell. 1993;75(4):805–816. [DOI] [PubMed] [Google Scholar]
- 33.Baldwin EL, Osheroff N. Etoposide, topoisomerase II and cancer. Curr Med Chem Anticancer Agents. 2005;5(4):363–372. [DOI] [PubMed] [Google Scholar]
- 34.Rodier F, Campisi J. Four faces of cellular senescence. J Cell Biol. 2011;192(4):547–556. [DOI] [PMC free article] [PubMed] [Google Scholar]
- 35.Prieur A, Peeper DS. Cellular senescence in vivo: a barrier to tumorigenesis. Curr Opin Cell Biol. 2008;20(2):150–155. [DOI] [PubMed] [Google Scholar]
- 36.Zhu J, Woods D, McMahon M, Bishop JM. Senescence of human fibroblasts induced by oncogenic Raf. Genes Dev. 1998; 12(19):2997–3007. [DOI] [PMC free article] [PubMed] [Google Scholar]
- 37.Lin AW, Barradas M, Stone JC, van Aelst L, Serrano M, Lowe SW. Premature senescence involving p53 and p16 is activated in response to constitutive MEK/MAPK mitogenic signaling. Genes Dev. 1998; 12(19):3008–3019. [DOI] [PMC free article] [PubMed] [Google Scholar]
- 38.Michaloglou C, Vredeveld LC, Soengas MS, et al. BRAFE600-associated senescence-like cell cycle arrest of human naevi. Nature. 2005;436(7051):720–724. [DOI] [PubMed] [Google Scholar]
- 39.Calabrese V, Mallette FA, Deschenes-Simard X, et al. SOCS1 links cytokine signaling to p53 and senescence. Mol Cell. 2009;36(5):754–767. [DOI] [PubMed] [Google Scholar]
- 40.Sabo A, Kress TR, Pelizzola M, et al. Selective transcriptional regulation by Myc in cellular growth control and lymphomagenesis. Nature. 2014;511(7510):488–492. [DOI] [PMC free article] [PubMed] [Google Scholar]
- 41.Collado M, Gil J, Efeyan A, et al. Tumour biology: senescence in premalignant tumours. Nature. 2005;436(7051):642. [DOI] [PubMed] [Google Scholar]
- 42.Braig M, Lee S, Loddenkemper C, et al. Oncogene-induced senescence as an initial barrier in lymphoma development. Nature. 2005;436(7051):660–665. [DOI] [PubMed] [Google Scholar]
- 43.Chen Z, Trotman LC, Shaffer D, et al. Crucial role of p53-dependent cellular senescence in suppression of Pten-deficient tumorigenesis. Nature. 2005; 436(7051): 725–730. [DOI] [PMC free article] [PubMed] [Google Scholar]
- 44.Akunuru S, Geiger H. Aging, Clonality, and Rejuvenation of Hematopoietic Stem Cells. Trends Mol Med. 2016;22(8):701–712. [DOI] [PMC free article] [PubMed] [Google Scholar]
- 45.Rossi DJ, Jamieson CH, Weissman IL. Stems cells and the pathways to aging and cancer. Cell. 2008;132(4):681–696. [DOI] [PubMed] [Google Scholar]
- 46.Rundberg Nilsson A, Soneji S, Adolfsson S, Bryder D, Pronk CJ. Human and Murine Hematopoietic Stem Cell Aging Is Associated with Functional Impairments and Intrinsic Megakaryocytic/Erythroid Bias. PloS One. 2016;11(7):e0158369. [DOI] [PMC free article] [PubMed] [Google Scholar]
- 47.Satake N, Maseki N, Nishiyama M, et al. Chromosome abnormalities and MLL rearrangements in acute myeloid leukemia of infants. Leukemia. 1999;13(7):1013–1017. [DOI] [PubMed] [Google Scholar]
- 48.Slater RM, von Drunen E, Kroes WG, et al. t(7;12)(q36;p13) and t(7;12)(q32;p13)--translocations involving ETV6 in children 18 months of age or younger with myeloid disorders. Leukemia. 2001;15(6):915–920. [DOI] [PubMed] [Google Scholar]
- 49.Taketani T, Taki T, Sako M, Ishii T, Yamaguchi S, Hayashi Y. MNX1-ETV6 fusion gene in an acute megakaryoblastic leukemia and expression of the MNX1 gene in leukemia and normal B cell lines. Cancer Genet Cytogenet. 2008;186(2):115–119. [DOI] [PubMed] [Google Scholar]
- 50.Balgobind BV, Hollink IH, Arentsen-Peters ST, et al. Integrative analysis of type-I and type-II aberrations underscores the genetic heterogeneity of pediatric acute myeloid leukemia. Haematologica. 2011; 96(10): 1478–1487. [DOI] [PMC free article] [PubMed] [Google Scholar]
Associated Data
This section collects any data citations, data availability statements, or supplementary materials included in this article.


