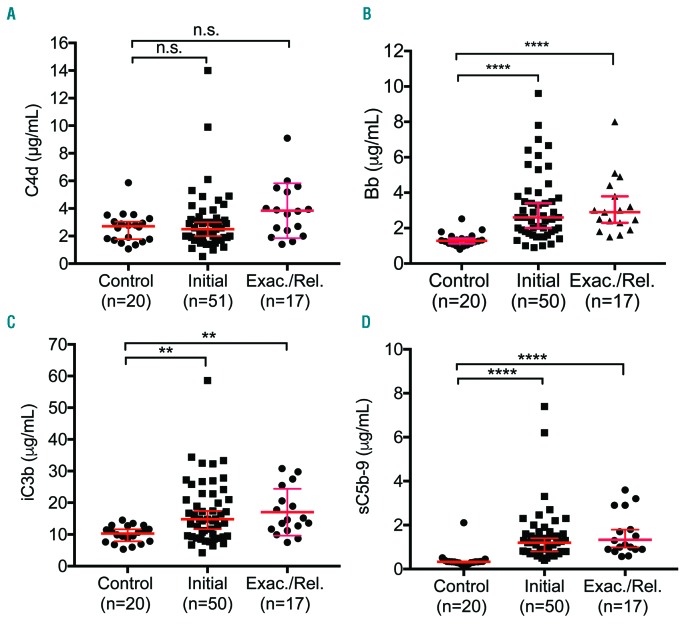
Figure 5.
Plasma levels of complement activation markers in patients with iTTP. Plasma levels of complement activation markers including C4d (A), Bb (B), iC3b (C), and sC5b-9 (D) in patients with acute iTTP (initial vs. exacterbated or relapsed) and the healthy controls. Each dot represents the value of each individual subject. The red solid lines are the medians ± 95% confidence interval. Kruskal-Willis analysis was used to determine the statistical significance. Here *, **, and **** indicate the P values of <0.01, and <0.0001, respectively; n.s. stands for no statistical difference.

