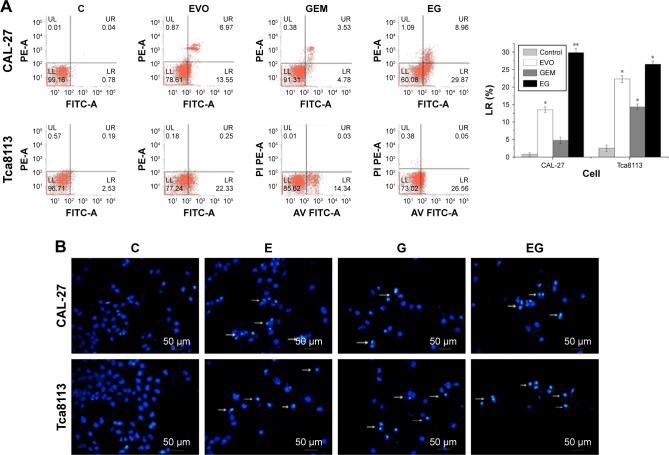
Figure 2.
The apoptosis rate (%) and the apoptotic morphology of cells were determined by FCM (A) and Hoechst33342 staining (B).
Notes: “C”, “E”, and “G” represent “control”, “EVO” and “GEM”, respectively. “EG” represents that the cells was sequential exposed to EVO for 24 hours followed by GEM for 24 hours. The “LR” represents “lower right quadrant”, indicating the ratio of early apoptotic cells. *P<0.05 and **P<0.01.
Abbreviations: EVO, evodiamine; FCM, flow cytometry; GEM, gemcitabine.

