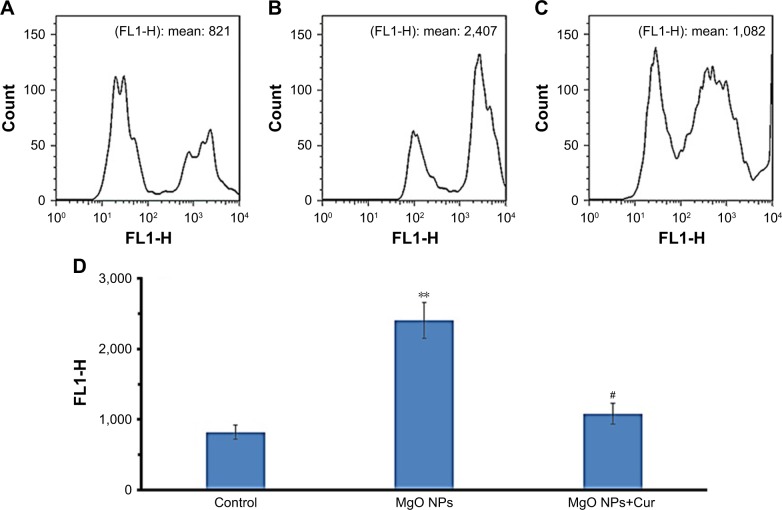
Figure 10.
The intracellular ROS formation by IC50 concentration of MgO NPs.
Notes: Upper graphs show generation of ROS in the K562 cells using H2DCF-DA dye. Control cells (A); MgO NPs-treated cells (B); pretreatment of cells with curcumin (50 µM) followed by MgO NPs treatment (C). Cells were incubated with IC50 concentration of MgO NPs for 24 hours. Histogram analysis of ROS generation by flow cytometer after MgO NPs incubation with K562 cells for 24 hours (D). Values represent mean ± SD of three experiments. **P<0.01, compared to control, #P<0.05, compared to MgO NP-treated group.
Abbreviations: MgO NPs, magnesium oxide nanoparticles; ROS, reactive oxygen species; Cur, curcumin.

