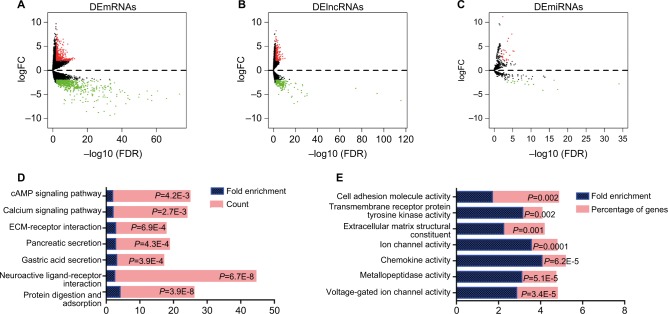
Figure 2.
Aberrantly expressed mRNAs, lncRNAs, and miRNAs in esophagus cancer and their enrichment analysis.
Notes: (A) Volcano plot of DEmRNAs between normal and tumor groups. Horizontal axis represents –log(false discovery rate [FDR]), and vertical axis represents log2(fold change [FC]). Red dots represent high-expression genes and green dots low-expression genes (adjusted P<0.05 and |log2(FC)|>2). (B) Volcano plot of DElncRNAs between normal and tumor group of esophagus cancer (adjusted P<0.05, |log2(FC)|>2). (C) Volcano plot of DEmiRNAs between normal and tumor groups (adjusted P<0.05, |log2(FC)|>2). (D) Significantly enriched KEGG pathways analysis of DEmRNAs. (E) Significantly enriched molecular function analysis of DEmRNAs.
Abbreviations: KEGG, Kyoto Encyclopedia of Genes and Genomes; FC, fold change.

