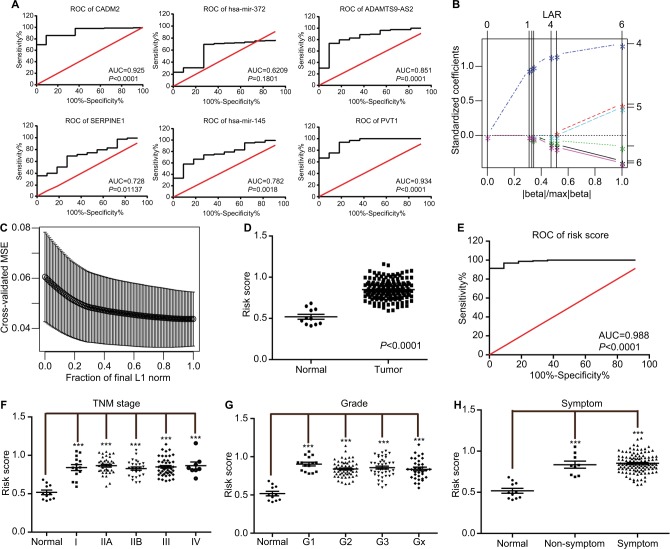
Figure 6.
ROC curves of risk model for the diagnosis of esophagus cancer.
Notes: (A) ROC curve of each element of the identified oncocers. Red line represents sensitivity curve, black line represents identity line. (B) Solution paths of LASSO regression model. The numbers on the right represent variables that each path corresponds to. The vertical lines indicates the event times for comparison between various solution paths. (C) The relationship between cross-validated MSE and model size. The confidence bars were made by the R function “lars”. The horizontal axis represents fraction of final L1 norm, which refers to the ratio of the L1 norm of the coefficient vector relative to the norm at the full least-squares solution for the model with the maximum steps used. (D) Distribution of risk scores of normal and tumor groups. (E) ROC curve of risk scores for distinguishing tumor from normal tissue. (F) Distribution of risk scores of different TNM stages. (G) Distribution of risk scores of different grades. (H) Distribution the risk scores in the presence and absence of symptoms. Oncocers: ceRNA-mediated crosstalk by sponging miRNAs in oncogenesis. ***P<0.001.
Abbreviations: ROC, receiver-operating characteristic; AUC, area under the curve; LASSO, least absolute shrinkage and selection operator; MSE, mean square error.

