International Journal of Epidemiology 2014, doi: 10.1093/ije/dyu191
Key Messages
Rankings are similar if different laboratories measure telomere lengths in the same samples.
TLR values for Labs 3 and 4 in round 2 as shown in Tab. 2 were not calculated from the set of raw values shown in suppl. Tab. S2, and this error was propagated through the following analyses. In addition, in suppl. Tab. S3, Pearson correlations were shown instead of Spearman’s correlation coefficients. Results based on the set of raw data shown in suppl. Tab S2 are provided below.
We correct the following statements (corrections underlined):
Results: Absolute results from different laboratories differed widely and could thus not be compared directly, but most rankings of relative telomere lengths were highly correlated (correlation coefficients 0.25 −0.99).
Table 2.
TLR as measured in the participating labs and inter-lab CVs in round 1 (to) and round 2 (bottom)
| Sample |
Round 1
|
||||||||||||
|---|---|---|---|---|---|---|---|---|---|---|---|---|---|
| Lab 1 | Lab 2 | Lab 3 | Lab 4 | Lab5 | Lab6 | Lab7 | Lab8 | Lab9 | CV for All Labs | CV for qPCR Labs | CV for qPCR triplets (median) | CV for South & STELA | |
| South | South | STELA | qPCR | qPCR | qPCR | qPCR | qPCR | qPCR | |||||
| A | 1.19 | 1.07 | 1.35 | 1.13 | 1.06 | 1.23 | 1.44 | 0.91 | 1.10 | 13.78 | 15.60 | 14.75 | 11.67 |
| B | 1.15 | 1.34 | 1.28 | 0.65 | 1.18 | 1.14 | 1.21 | 1.34 | 1.16 | 17.89 | 21.44 | 19.23 | 7.68 |
| C | 1.91 | 1.61 | 1.85 | 1.51 | 1.72 | 1.53 | 2.35 | 1.55 | 1.78 | 15.17 | 18.40 | 13.66 | 8.92 |
| D | 1.08 | 1.26 | 1.07 | 0.59 | 0.66 | 0.83 | 1.13 | 0.83 | 0.63 | 27.45 | 25.75 | 18.78 | 9.38 |
| E | 0.63 | 0.87 | 0.44 | 0.22 | 0.36 | 0.79 | 0.13 | 0.31 | 57.53 | 61.59 | 52.56 | 22.86 | |
| F | 0.63 | 0.79 | 0.79 | 0.39 | 0.19 | 0.28 | 0.46 | 0.39 | 0.14 | 53.46 | 40.54 | 42.92 | 12.80 |
| G a | 1.00 | 1.00 | 1.00 | 1.00 | 1.00 | 1.00 | 1.00 | 1.00 | 1.00 | ||||
| H | 0.64 | 0.68 | 0.75 | 0.17 | 0.31 | 0.33 | 0.31 | 0.13 | 57.93 | 36.87 | 41.46 | 7.79 | |
| I | 0.91 | 1.11 | 0.94 | 1.30 | 1.52 | 1.10 | 1.80 | 1.39 | 1.79 | 25.44 | 18.65 | 16.93 | 10.86 |
| J | 0.90 | 0.95 | 0.94 | 0.88 | 0.86 | 0.83 | 1.15 | 0.89 | 0.89 | 10.21 | 12.83 | 9.74 | 2.68 |
| Sample b |
Round 2
|
||||||||||||||
|---|---|---|---|---|---|---|---|---|---|---|---|---|---|---|---|
| Lab 1 | Lab 2 | Lab 3 | Lab 4 | Lab5 | Lab6 | Lab7 | Lab8 | Lab9 | Lab 10 | Lab 10-2 | CV for All Labs | CV for qPCR Labs | CV for qPCR triplets (median) | CV for South & STELA | |
| South | South | STELA | qPCR | qPCR | qPCR | qPCR | qPCR | qPCR | qPCR | qPCR | |||||
| B | 1.39 | 1.37 | 1.51 | 0.84 | 1.13 | 1.06 | 1.43 | 1.20 | 0.99 | 0.85 | 0.98 | 20.62 | 18.48 | 16.69 | 5.54 |
| C | 1.52 | 1.54 | 1.54 | 1.73 | 1.54 | 1.50 | 1.64 | 1.73 | 1.93 | 1.55 | 11.06 | 12.32 | 8.93 | 6.31 | |
| C | 1.56 | 1.53 | 1.76 | 1.78 | 1.55 | 1.59 | 1.61 | 1.53 | 1.65 | 1.63 | 0.99 | ||||
| K | 0.99 | 1.05 | 1.12 | 0.68 | 0.58 | 0.74 | 1.04 | 0.84 | 0.50 | 0.73 | 0.74 | 24.89 | 22.15 | 19.87 | 6.24 |
| L | 0.99 | 1.08 | 0.83 | 0.42 | 0.60 | 0.65 | 0.60 | 0.65 | 0.45 | 0.73 | 30.74 | 22.21 | 19.99 | 6.53 | |
| G | 0.94 | 0.95 | 0.94 | 1.02 | 0.97 | 1.03 | 0.94 | 1.00 | 1.01 | 1.11 | 1.33 | 7.93 | 8.64 | 4.64 | 3.25 |
| G a | 1.00 | 1.00 | 1.00 | 1.00 | 1.00 | 1.00 | 1.00 | 1.00 | 1.00 | 1.00 | 1.00 | ||||
| H | 0.57 | 0.69 | 0.75 | 0.38 | 0.19 | 0.31 | 0.31 | 0.11 | 0.12 | 0.19 | 62.27 | 39.89 | 37.06 | 13.19 | |
| H | 0.56 | 0.71 | 0.77 | 0.38 | 0.21 | 0.27 | 0.28 | 0.29 | 0.11 | 0.13 | 0.21 | ||||
| I | 0.87 | 0.99 | 0.99 | 1.28 | 1.48 | 1.25 | 1.32 | 1.37 | 1.61 | 1.44 | 1.38 | 18.17 | 8.48 | 7.26 | 7.67 |
| Median | 22.76 | 20.05 | 17.86 | 7.74 | |||||||||||
TLR, telomere length ratio; CVs, coefficients of variation.
a All TLR values were calculated as the ratio of the estimated telomere length for a particular sample, divided by the estimated telomere length for sample G.
b The second round of measurements was designed to enable inter-batch comparison and included 5 repeat samples from the first round (B, C, G, H, I), of which samples C, G and H were duplicated (for intra-batch comparison). CVs for qPCR labs were higher than those for Southern/STELA labs (p = 0.000, paired t-test).
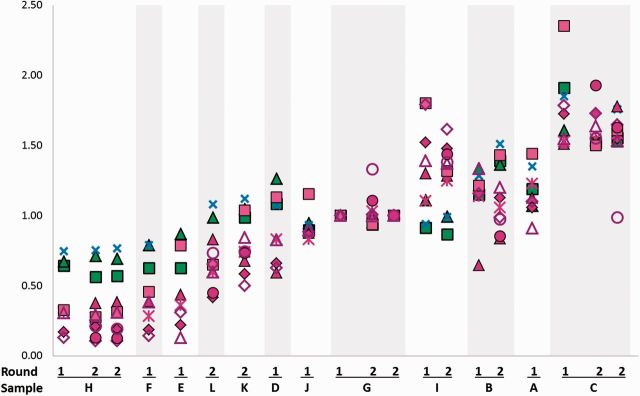
Figure 1.
Telomere length ratios (TLRs) by laboratory, round and sample. TLRs are normalized to sample G, first round. Symbols indicate laboratories and techniques. Green indicates SOUTH, blue indicates STELA and pink symbols indicate qPCR. ▪ Lab 1 South; ▴ Lab 2 South; ✗ Lab 3 STELA; ▴ Lab 4 qPCR; ♦ Lab 5 qPCR; * Lab 6 qPCR; ▪ Lab 7 qPCR; Δ Lab 8 qPCR; ♦ Lab 9 qPCR; • Lab 10 qPCR duplex; ○ Lab 10-2 qPCR monoplex.
Figure 2.
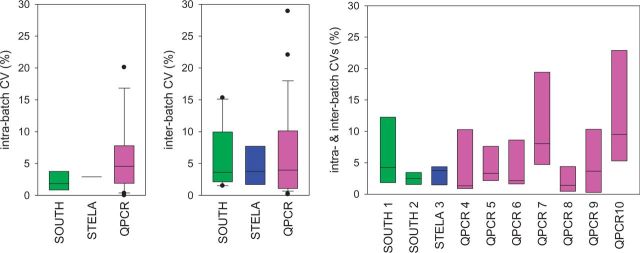
Figure 3.
(a–c).
Table 3.
Intra-batch CVs per laboratory
| Sample | Lab 1 | Lab 2 | Lab 3 | Lab 4 | Lab5 | Lab6 | Lab7 | Lab8 | Lab9 | Lab 10 | Lab 10-2 |
|---|---|---|---|---|---|---|---|---|---|---|---|
| name | South | South | STELA | qPCR | qPCR | qPCR | qPCR | qPCR | qPCR | qPCR | qPCR |
| C | 1.702 | 0.178 | 10.294 | 7.799 | 1.903 | 4.771 | 4.566 | 3.354 | 11.934 | 31.299 | |
| G | 4.614 | 3.481 | 4.374 | 1.331 | 2.162 | 2.156 | 4.721 | 0.324 | 0.470 | 7.095 | 20.089 |
| H | 1.083 | 2.007 | 1.489 | 1.304 | 7.018 | 8.985 | 3.861 | 0.000 | 2.404 | 6.264 |
Table 4.
Inter-batch CVs per laboratory
| Sample | Lab 1 | Lab 2 | Lab 3 | Lab 4 | Lab 5 | Lab 6 | Lab 7 | Lab 8 | Lab 9 |
|---|---|---|---|---|---|---|---|---|---|
| name | Tech 1 | Tech 1 | Tech 2 | Tech 3 | Tech 3 | Tech 3 | Tech 3 | Tech 3 | Tech 3 |
| B | 13.388 | 1.499 | 11.627 | 17.989 | 3.046 | 5.215 | 11.522 | 7.431 | 11.314 |
| C | 15.305 | 3.368 | 3.772 | 6.497 | 3.564 | 1.652 | 28.906 | 1.709 | 3.973 |
| G | 2.270 | 1.719 | 2.154 | 0.669 | 1.073 | 1.086 | 2.322 | 0.162 | 0.235 |
| H | 8.813 | 2.980 | 1.259 | 11.650 | 8.925 | 7.144 | 0.850 | 13.671 | |
| I | 3.877 | 7.991 | 3.755 | 0.897 | 2.175 | 8.620 | 22.052 | 1.093 | 7.395 |
Suppl. Table S3.
Spearman’s rank correlation coefficients between participating laboratories
| Round 1 | Lab 1 South | Lab 2 South | Lab 3 STELA | Lab 4 qPCR | Lab 5 qPCR | Lab 6 qPCR | Lab 7 qPCR | Lab 8 qPCR | Lab 9 qPCR |
|---|---|---|---|---|---|---|---|---|---|
| Lab 1 South | 1.000 | ||||||||
| Lab 2 South | 0.855 | 1.000 | |||||||
| Lab 3 STELA | 0.983 | 0.867 | 1.000 | ||||||
| Lab 4 qPCR | 0.650 | 0.600 | 0.524 | 1.000 | |||||
| Lab 5 qPCR | 0.770 | 0.855 | 0.750 | 0.900 | 1.000 | ||||
| Lab 6 qPCR | 0.879 | 0.818 | 0.867 | 0.867 | 0.939 | 1.000 | |||
| Lab 7 qPCR | 0.770 | 0.842 | 0.750 | 0.883 | 0.952 | 0.915 | 1.000 | ||
| Lab 8 qPCR | 0.770 | 0.806 | 0.700 | 0.867 | 0.952 | 0.867 | 0.867 | 1.000 | |
| Lab 9 qPCR | 0.709 | 0.818 | 0.667 | 0.883 | 0.988 | 0.903 | 0.939 | 0.939 | 1.000 |
| Round 2 | Lab 1 South | Lab 2 South | Lab 3 STELA | Lab 4 qPCR | Lab 5 qPCR | Lab 6 qPCR | Lab 7 qPCR | Lab 8 qPCR | Lab 9 qPCR | Lab 10 qPCR | Lab 10-2 qPCR |
|---|---|---|---|---|---|---|---|---|---|---|---|
| Lab 1 South | 1.000 | ||||||||||
| Lab 2 South | 0.933 | 1.000 | |||||||||
| Lab 3 STELA | 0.929 | 0.950 | 1.000 | ||||||||
| Lab 4 qPCR | 0.700 | 0.685 | 0.483 | 1.000 | |||||||
| Lab 5 qPCR | 0.783 | 0.855 | 0.667 | 0.927 | 1.000 | ||||||
| Lab 6 qPCR | 0.690 | 0.733 | 0.476 | 0.933 | 0.967 | 1.000 | |||||
| Lab 7 qPCR | 0.883 | 0.927 | 0.817 | 0.806 | 0.927 | 0.917 | 1.000 | ||||
| Lab 8 qPCR | 0.800 | 0.842 | 0.650 | 0.915 | 0.988 | 0.967 | 0.939 | 1.000 | |||
| Lab 9 qPCR | 0.695 | 0.693 | 0.477 | 0.985 | 0.936 | 0.917 | 0.802 | 0.936 | 1.000 | ||
| Lab 10 qPCR | 0.683 | 0.733 | 0.500 | 0.976 | 0.952 | 0.933 | 0.830 | 0.939 | 0.985 | 1.000 | |
| Lab 10-2 qPCR | 0.450 | 0.576 | 0.250 | 0.867 | 0.855 | 0.750 | 0.661 | 0.842 | 0.912 | 0.927 | 1.000 |
Suppl. Table S4.
z-scored results from all participating laboratories in round 1 (top) and 2 (bottom) and inter-laboratory variation in z scores (as standard deviation) between all laboratories and separated by technique
| Lab 1 | Lab 2 | Lab 3 | Lab 4 | Lab 5 | Lab 6 | Lab 7 | Lab 8 | Lab 9 | Lab 10 | lab 10-2 | SD | SD | SD South/ |
|---|---|---|---|---|---|---|---|---|---|---|---|---|---|
| South | South | STELA | qPCR | qPCR | qPCR | qPCR | qPCR | qPCR | qPCR | qPCR | all | qPCR | STELA |
| round 1 | |||||||||||||
| 0.453 | −0.012 | 0.751 | 0.480 | 0.306 | 0.703 | 0.663 | −0.033 | 0.319 | 0.288 | 0.271 | 0.385 | ||
| 0.344 | 0.928 | 0.540 | −0.666 | 0.527 | 0.492 | 0.239 | 0.876 | 0.417 | 0.463 | 0.524 | 0.296 | ||
| 2.414 | 1.894 | 2.280 | 1.395 | 1.538 | 1.419 | 2.370 | 1.330 | 1.484 | 0.453 | 0.389 | 0.270 | ||
| 0.165 | 0.670 | −0.094 | −0.795 | −0.426 | −0.242 | 0.083 | −0.210 | −0.491 | 0.426 | 0.298 | 0.390 | ||
| −1.075 | −0.727 | −1.172 | −1.245 | −1.358 | −0.561 | −1.699 | −1.030 | 0.357 | 0.379 | 0.246 | |||
| −1.073 | −1.004 | −0.958 | −1.280 | −1.303 | −1.541 | −1.176 | −1.159 | −1.312 | 0.181 | 0.138 | 0.058 | ||
| −0.061 | −0.264 | −0.320 | 0.177 | 0.201 | 0.165 | −0.162 | 0.161 | 0.147 | 0.209 | 0.137 | 0.136 | ||
| −1.035 | −1.416 | −1.092 | −1.333 | −1.474 | −1.423 | −1.327 | −1.337 | 0.158 | 0.067 | 0.205 | |||
| −0.295 | 0.129 | −0.506 | 0.891 | 1.166 | 0.413 | 1.338 | 0.998 | 1.496 | 0.723 | 0.382 | 0.324 | ||
| −0.338 | −0.457 | −0.519 | −0.117 | −0.054 | −0.236 | 0.124 | −0.066 | −0.049 | 0.213 | 0.117 | 0.092 | ||
| round 2 | |||||||||||||
| 0.998 | 1.029 | 1.242 | −0.217 | 0.435 | 0.300 | 0.643 | 0.591 | 0.124 | −0.143 | 0.140 | 0.483 | 0.317 | 0.133 |
| 1.349 | 1.635 | 1.454 | 1.549 | 1.455 | 0.778 | 1.521 | 1.386 | 1.624 | 1.397 | 0.398 | 0.414 | 0.244 | |
| 1.449 | 1.622 | 1.987 | 2.030 | 1.215 | 1.554 | 0.974 | 1.302 | 1.250 | 1.131 | 0.169 | |||
| −0.093 | −0.098 | 0.043 | −0.592 | −0.572 | −0.455 | −0.095 | −0.177 | −0.705 | −0.336 | −0.365 | 0.247 | 0.210 | 0.080 |
| −0.313 | −0.073 | −0.231 | −0.880 | −0.794 | −0.817 | −0.704 | −0.444 | −0.803 | −0.387 | 0.289 | 0.242 | 0.170 | |
| −0.233 | −0.434 | −0.503 | 0.222 | 0.146 | 0.239 | −0.283 | 0.151 | 0.158 | 0.273 | 0.919 | 0.310 | 0.245 | 0.157 |
| −0.061 | −0.264 | −0.320 | 0.177 | 0.201 | 0.165 | −0.162 | 0.161 | 0.147 | 0.100 | 0.195 | |||
| −1.228 | −1.349 | −1.077 | −1.313 | −1.295 | −1.446 | −1.317 | −1.376 | −1.336 | −1.566 | 0.138 | 0.104 | 0.123 | |
| −1.252 | −1.278 | −1.028 | −1.296 | −1.258 | −1.561 | −1.517 | −1.352 | −1.376 | −1.329 | −1.527 | |||
| −0.428 | −0.292 | −0.351 | 0.853 | 1.081 | 0.754 | 0.429 | 0.953 | 1.193 | 0.819 | 1.024 | 0.615 | 0.235 | 0.068 |
| median | 0.310 | 0.245 | 0.170 | ||||||||||
Table 5.
Test results
|
Analysis
|
original value in the paper | corrected value | |||
|---|---|---|---|---|---|
| Spearman’s rank correlation coefficients (abstract and results p4 1 st para) | Range: 0.63 −0.99 | Range: 0.25 −0.99 | |||
| Paired T-test CVs (SB+STELA) vs CVs qPCR (Results p.4 2 nd para) | p = 0.001 | p = 1.8x10 −7 | |||
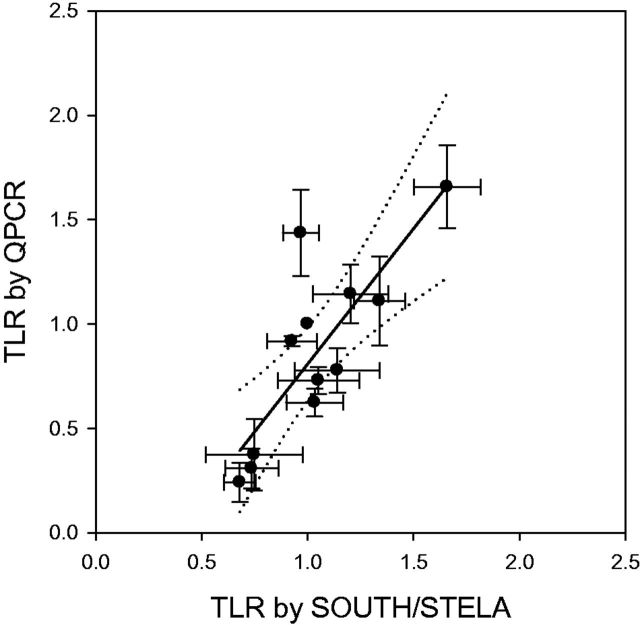
| Linear regression of LTRs South/STELA vs qPCR (p6 1 st para) | Offset: −0.55 ± 0.32 | Offset: −0.49 ± 0.32 | |||
| Slope: 1.38 ± 0.30 | Slope: 1.30 ± 0.30 | ||||
| Intra-batch CV values (Table 3, p6 2 nd para) | Differences between labs | Labs 1 to 10-1 ANOVA, p = 0.299 | Labs 1 to 10.1 ANOVA, p = 0.299 | ||
| Labs 1 to 10-2 Kruskal-Wallis, p = 0.089 | |||||
| Median intra-batch CVs per technique | 1.86% (SB); 2.83% (STELA); 4.57% (qPCR) | 1.86% (SB); 2.93% (STELA); 4.57% (qPCR) | |||
| Differences between techniques (Kruskal-Wallis) | p = 0.161 | p = 0.201 | |||
| Differences between techniques with SOUTH and STELA combined (Mann-Whitney) | p = 0.075 | p = 0.082 | |||
| Analysis | original value in the paper | corrected value | |||
|---|---|---|---|---|---|
| Inter-batch CV values (Table 4, p7) | Differences between labs (Kruskal-Wallis) | p = 0.195 | p = 0.190 | ||
| Median inter-batch CVs per technique | 3.62% (SB); 4.78% (STELA); 4.65% (qPCR) | 3.62% (SB); 3.76% (STELA); 3.97% (qPCR) | |||
| Differences between techniques (Kruskal-Wallis) | p = 0.840 | p = 0.842 | |||
| Intra- & Inter-batch CV values combined (p7, 2 nd para) | Differences between labs (Kruskal-Wallis) | p = 0.060 | p = 0.052 | ||
| GLM (p8) | Null hypothesis of equal variance between all groups | F = 1.650; p = 0.096 | F = 1.998; p = 0.036 | ||
| Partial eta-squared coefficients: | Partial eta-squared coefficients: | ||||
| LAB | .013 | LAB | .014 | ||
| TECHN | .000 | TECHN | .000 | ||
| LAB * TECHN | .000 | LAB * TECHN | .000 | ||


