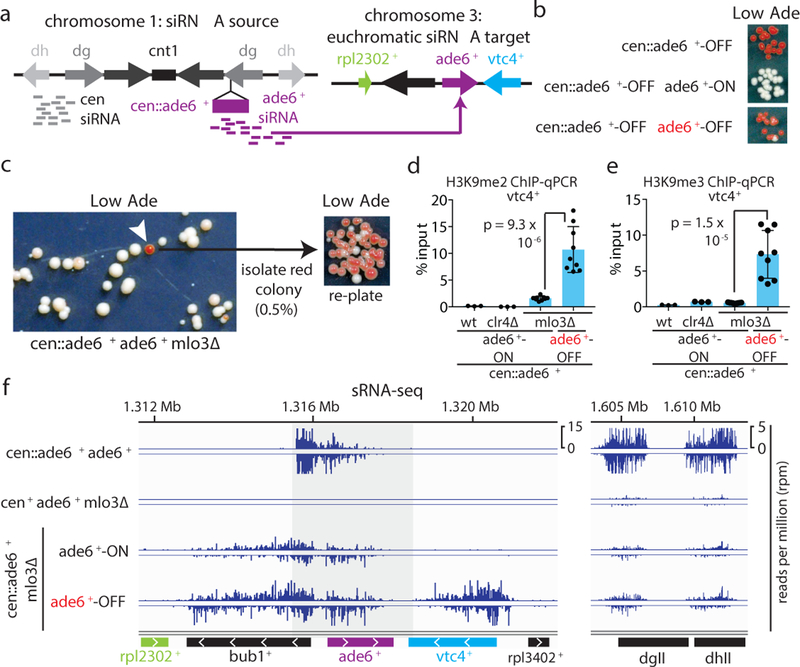
Figure 1 |. Establishment of siRNA-mediated silencing at the euchromatic ade6+ locus is associated with local siRNA generation and H3K9 methylation.
a, Schematic of the cen::ade6+ siRNA driver (left) and euchromatic ade6+ target (right) loci.
b, Expected phenotypes of cells containing the silenced cen::ade6+ locus alone or in combination with the euchromatic ade6+ in either expressed (ON/red) or silenced (OFF/red) states.
c, cen::ade6+ mlo3∆ cells were plated on low adenine medium. ~0.5% of cells formed red or pink colonies, indicating silencing of euchromatic ade6+ (white arrow). Repeated three times with similar results.
d-e, ChIP-qPCR assays showing H3K9me2 (d) or H3K9me3 (e) in ade6+-OFF (red) compared to ade6+-ON (white) cells at vtc4+. Sample means +/− SD from 3 (wt, clr4∆) or 9 (mlo3∆) biological replicates (reflecting 3 independent clones); p values resulting from a 2-tailed Student’s t-test.
f, Left, siRNA-sequencing showing increased secondary siRNA generation in ade6+-OFF compared to ade6+-ON cells. Note that for the ade6+ gene itself and the immediately flanking sequences, the siRNA and H3K9me signals at the euchromatic and centromeric copies cannot be distinguished (shaded area represent sequence identity). Right, siRNAs mapping to the pericentromeric repeats (dgII and dhII) of chromosome 2 shown as controls. Sequencing was performed once but see Fig. 3e, ED Fig. 3d, and ED Fig 8d for related results.

