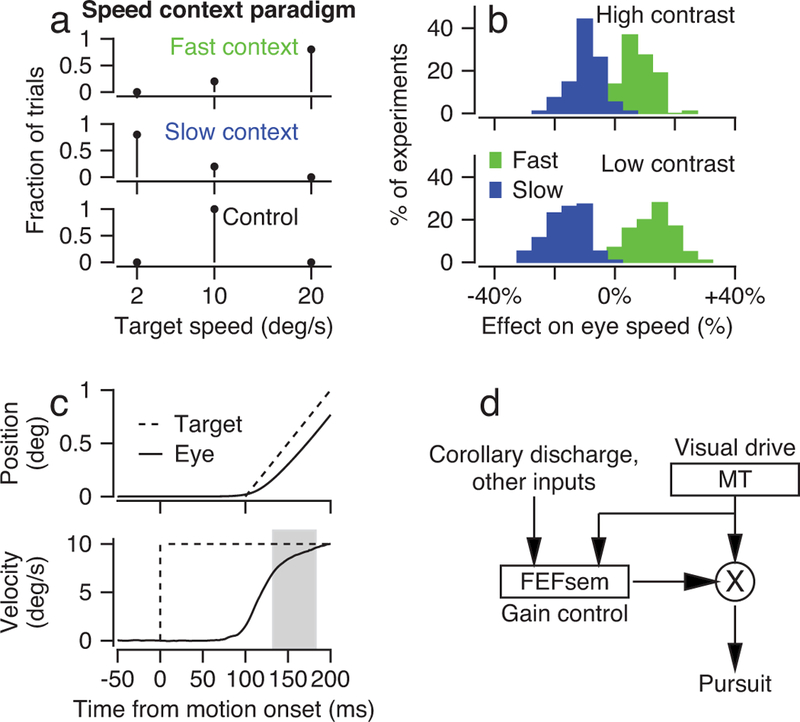
Figure 1. Effect of speed context on behavior.

a: Schematic shows the fraction of speeds of target motion in each speed context. b: Histograms compare eye speed for high-contrast (top) versus low-contrast (bottom) targets for the 10 deg/s target motion during the fast (green) and slow (blue) context. The x-axis shows eye speed as a percentage change from eye speed measured in control blocks for the same stimulus speed and contrast. Data are for 95 speed-context experiments during which neural responses were recorded. c: Eye movements during the initiation of pursuit for target motion showing position in the top graph and speed in the bottom graph. Dashed and continuous traces show target and eye movement, and the gray rectangle shows the analysis interval for the initiation of pursuit. Note that the first 100 ms of target motion comprises local motion within a stationary aperture, and the target position starts to ramp 100 ms after the target velocity steps to 10 deg/s. d: A simplified circuit diagram based on previous knowledge of how signals emanating from FEFSEM control the gain of visual motion signals from area MT to the oculomotor machinery to drive pursuit eye movements.
