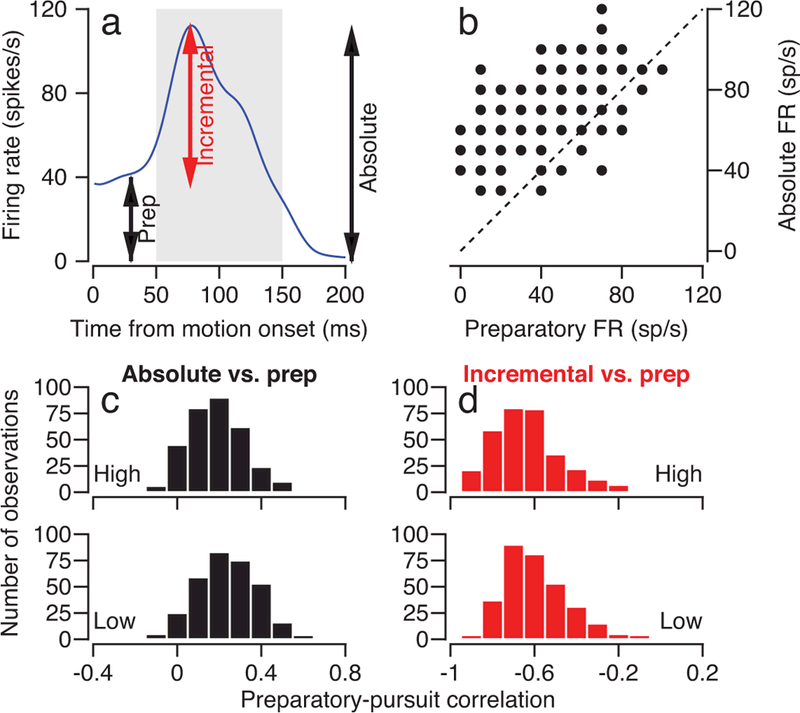
Figure 5. Trial-by-trial correlation between preparatory and pursuit firing rate.

a: The curve replots (from Figure 4a) the average firing rate over time of one example neuron. Arrows indicate the three firing rate measurements used for the correlation analysis in b-d. b: Scatter plot showing trial-by-trial correlations between preparatory and absolute pursuit-related firing rate for an example neuron. Each symbol shows measurements for one trial. The dashed line represents the unity line. The Pearson correlation coefficient is 0.46. c: Histograms showing the distribution of trial-by-trial Pearson correlation coefficients between preparatory modulation of firing rate and absolute pursuit-related firing rate. Top and bottom histograms show data for the high- and low-contrast target motions, both at 10 deg/s. d: as in c, except that correlation is between preparatory modulation of firing rate and the incremental firing rate from the preparatory level during pursuit initiation. Each neuron could have contributed more than one “observation” for target motion in different directions. Data in c and d summarize results from 321 data points, from 95 speed context experiments in 164 neurons.
