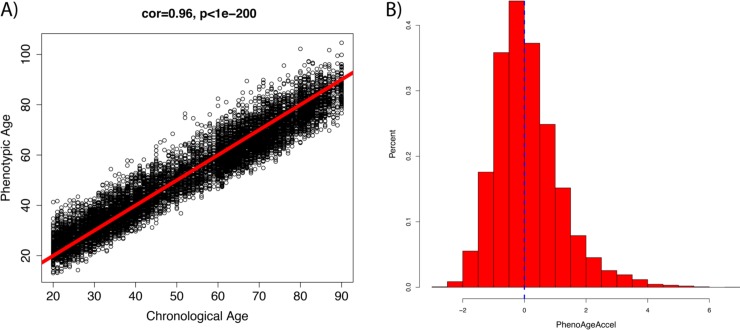
Fig 3. Relationship between Phenotypic Age, chronological age, and PhenoAgeAccel.
(A) As expected, Phenotypic Age was highly correlated with chronological age, partially due to the fact that it includes chronological age. The red line depicts the expected Phenotypic Age for each chronological age, with points above the line depicting people who were phenotypically older than expected, and points below the line depicting those who were phenotypically younger than expected. (B) PhenoAgeAccel was fairly normally distributed, with a mean of 0 (blue line), a standard deviation of 1, and a median of −0.13.

