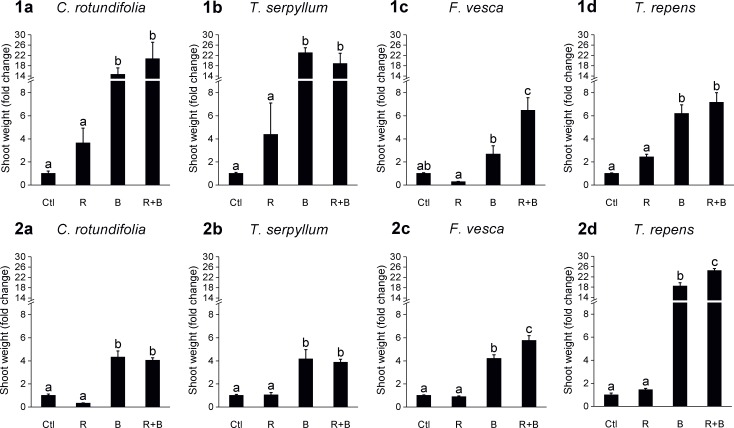
Fig 2. Fold change in shoot weight of four plant species whose results were consistent across the two NaPPI experiments.
Bars (mean ± SE) represent fold changes in shoot weight of R, B, and R+B treated plants as compared with untreated control plants (Ctl). Graphs in the upper and lower row are from the first (1) and second (2) NaPPI experiment, respectively. (a−d) Data from C. rotundifolia (a), T. serpyllum (b), F. vesca (c), and T. repens (d). Different lowercase letters above the bars indicate statistical differences (LSD0.05) between the treatments at P < 0.05.

