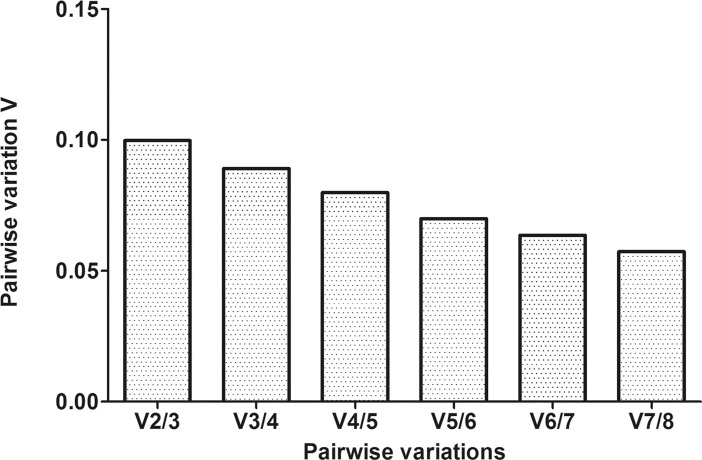
Fig 1. Evaluation of reference genes using geNorm across all tested samples.
Determination of the optimal number of reference genes for normalization relied on the pairwise variation (Vn/n + 1) analysis. Every bar represents a change in normalization accuracy with the stepwise addition more of reference genes. The figure indicates that there is no need to include more than two genes into the normalization factor.

