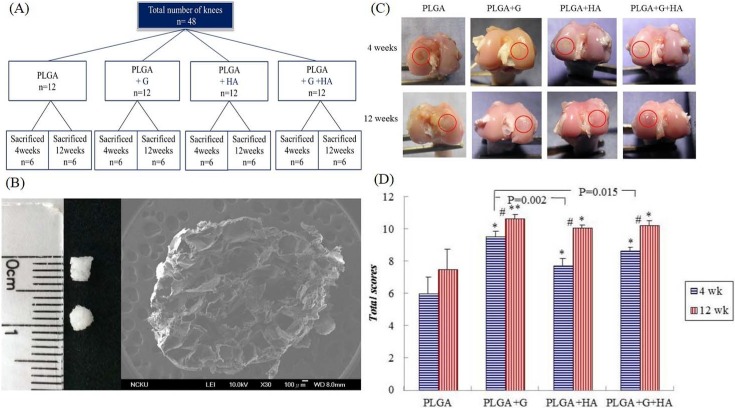
Fig 1.
(A) Schematic diagram of the animal study groups. (B) PLGA sponge scaffold. Photograph image shows the dimension of the PLGA scaffolds. Scanning electron microscope image shows the porous structure of the PLGA scaffold. (C) Representative images of the gross appearances of the four groups at 4 weeks and 12 weeks after surgery. Circles surround the repaired osteochondral defect area. (D) Quantitative scores of the gross appearances of the four groups at 4 weeks and 12 weeks. #Between two time points, p<0.05. *Compared with the PLGA group, p<0.05. **Compared with the PLGA group, p<0.001.

