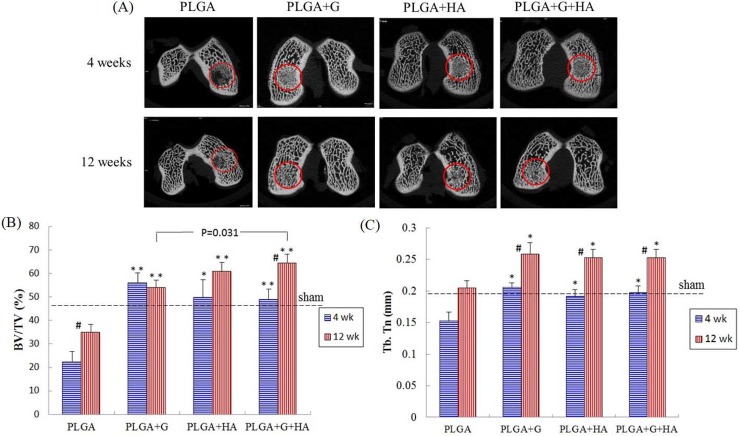
Fig 2.
(A) The micro-CT images for bone assessment of each group at 4 weeks and 12 weeks after surgery. Circles surround the repaired osteochondral defect area. (B) Quantification scores of BV/TV. (C) Quantification scores of the Tb.Th. #Between two time points, p<0.05. *Compared with the PLGA group, p<0.05, **Compared with the PLGA group, p<0.001.

