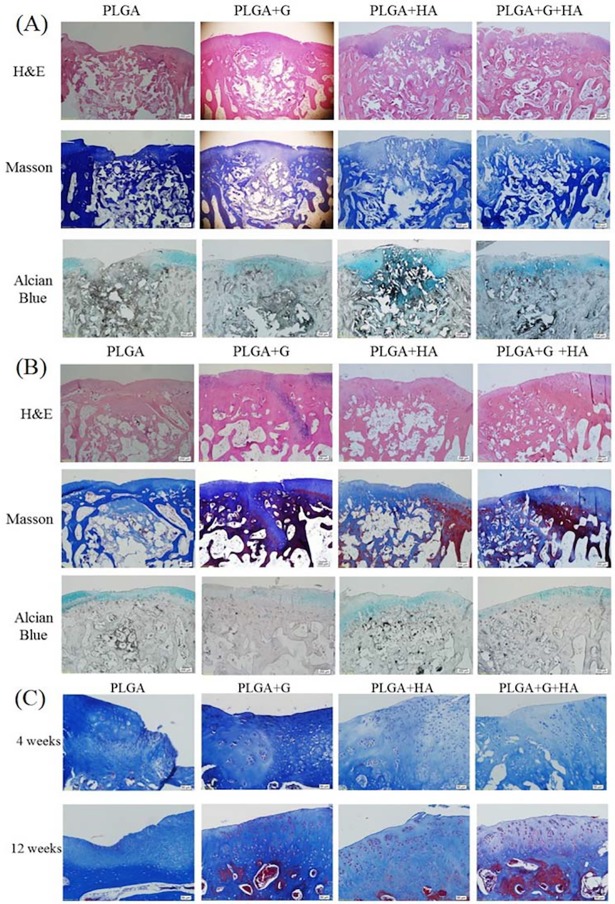
Fig 3.
Representative images of (A) Histological examinations with staining of the repaired area using hematoxylin and eosin (H&E), Masson’s trichrome, and Alcian blue at 4 weeks. Scale bar: 200 μm. (B) Histological examinations with staining of the repaired area using H&E, Masson’s trichrome, and Alcian blue at 12 weeks. Scale bar: 200 μm. The region of yellow arrows indicated the original outline of the implant. (C) Higher magnifications of the defect areas of each group using Masson’s stain. Scale bar: 50 μm.

