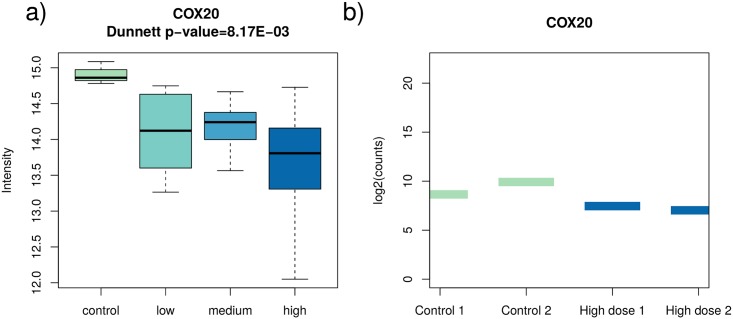
Fig 6. The down-regulated COX20 shown as an exemplary coherent deregulated transcript-protein pair.
The boxplots in a) show the statistical summary of protein expression values in each dose group, whereas the bars in plot b) present the gene expression for each available individual transcript sample on the logarithmic scale. The plot illustrates the declining direction of protein expression, and though there is a large range of values in the high-dose group distribution, a significant difference is observed compared to the control group (Dunnett test p-value 8.17E-03). Likewise, in the RNA-seq data gene expression drops in this case.

