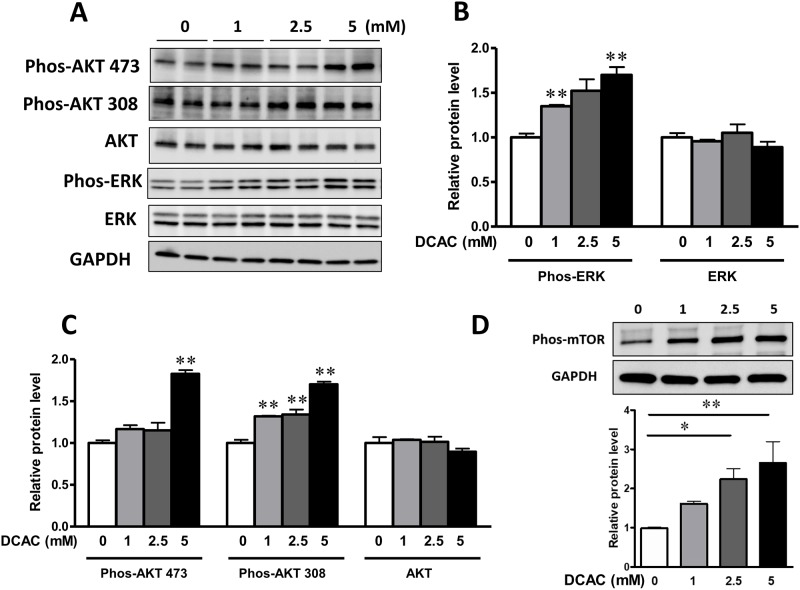
Fig 5. DCAC up-regulated the AKT/mTOR and MAPK signaling in KCs.
KCs were pre-treated with DCAC at concentrations of 0, 1, 2.5 or 5 mM for 24 h. (A) Representative images of the cellular levels of phos-AKT S473, phos-AKT T308, total AKT, phos-ERK and ERK, as determined by Western blotting, (B) Relative phos-ERK level, as determined by Western blotting, (C) Relative protein levels of phos-AKT(Ser-473) and phos-AKT(Thr-308), as determined by Western blotting, and (D) Representative images and relative phos-mTOR, as determined by Western blotting. n = 3 in each group. *p<0.05; **p<0.01, as compared to the controls.

