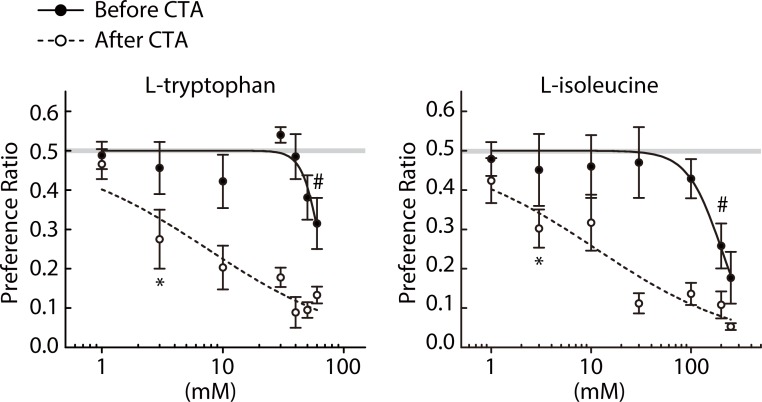
Fig 2. Two-bottle preference ratios for concentration series of L-tryptophan (n = 8) and L-isoleucine (n = 8) measured before (closed circles) and after (open circles) poisoning with LiCl.
# and * indicate the lowest concentrations at which preference ratios fell significantly (p < 0.05) below indifference (0.5) before and after CTA, respectively. Solid and dashed lines represent curves fit to the average ratios before and after CTA, respectively. Gray lines represent the indifference level (0.5).

