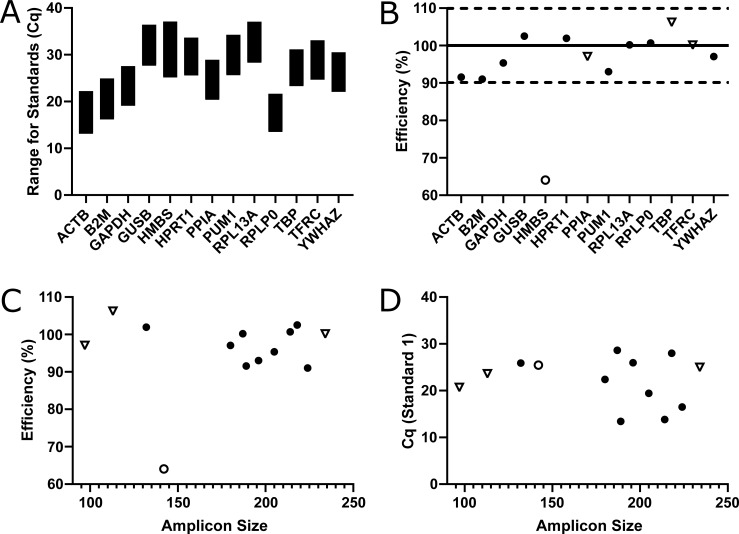
Fig 3. Primer efficiency and gene quantity.
All genes could be detected by their respective primer sets (A) of which most were within the set efficiency range of 90–110% (B). Dotted lines define efficiency boundaries and the solid line represents 100% efficiency. Only HMBS had a too low efficiency (< 90% which is represented as an open dot). The length of the formed product (amplicon) does not have linear correlation to the efficiency (C; r2 = 0.007705, p = 0.7755) or to the abundancy indicated by the Cq of the first standard (D; r2 = 0.03130, p = 0.5631). Primer sets potentially having annealing difficulties caused by possible folding of the amplicon as indicated by mFold analysis (Table 1) are depicted as open triangles.

