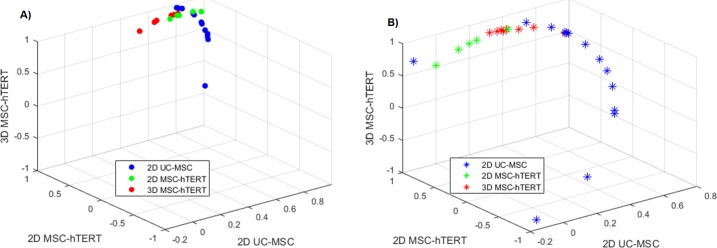
Fig 5. Relative grouped-correlation for each sample against the three different sample groups.
The data normalised against the three most stable reference genes is shown in a), represented by solid spheres. The data normalised against the three least stable reference genes is shown in b), represented by asterisks. Colour coding for the three groups: Blue, 2D UC-MSC; green, 2D MSC-hTERT; red, 3D MSC-hTERT.

