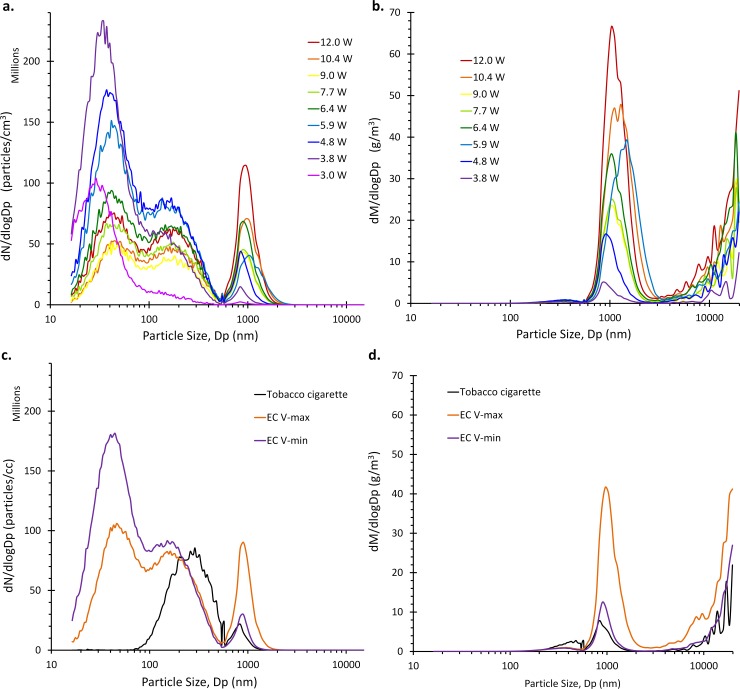
Fig 3. Particle size and mass distributions for EC aerosols and tobacco smoke.
a.) EC aerosols produced by a 2nd generation EC atomizer powered by a laboratory power supply at 9 different levels. Nano-sized particle count decreased as power increased but micron sized particles increased as power increased. b.) Mass distribution of EC aerosol calculated from particle size distribution. Large particles make up the majority of aerosol mass. c.) EC aerosols produced by the same atomizer powered by a variable voltage EC battery at Vmin and Vmax dial settings and compared to a Kool Blue cigarette smoke aerosol. Note the distinct difference between EC aerosol and cigarette smoke. Data shown are average of three trials. d.) Mass distribution of EC aerosol and cigarette smoke calculated from particle size distribution. Battery powered EC aerosol has a smaller particle mode around 1 μm than observed in power supply experiments which may be due to battery underperformance. Data shown are average of three trials.

