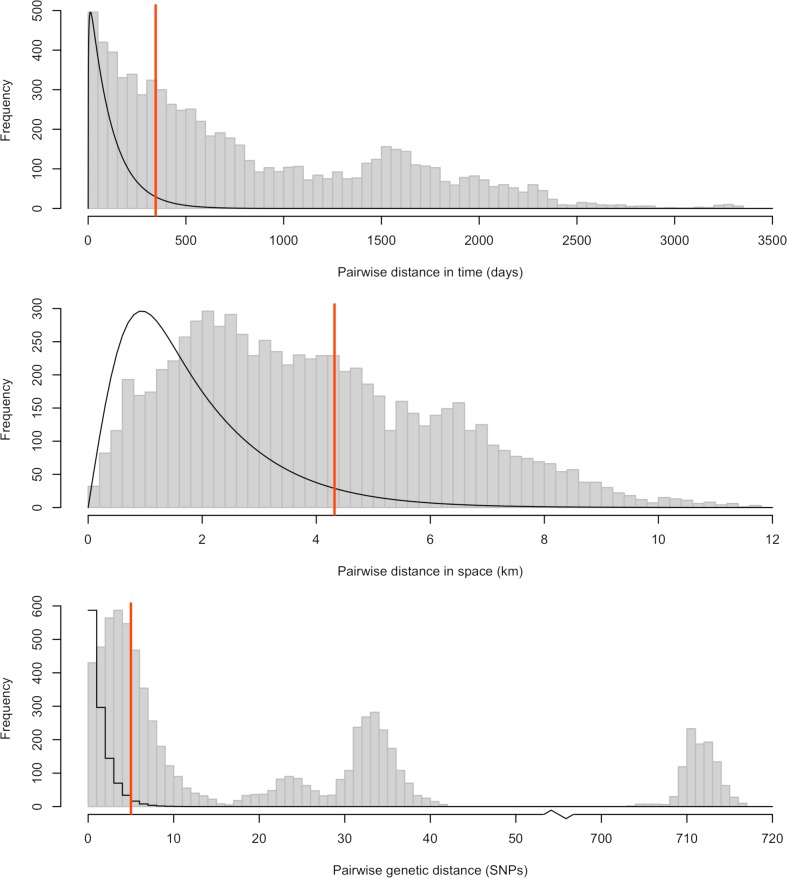
Fig 3.
Distribution of pairwise temporal (top), spatial (middle) and genetic (bottom) distances for rabies in Bangui. The temporal distance is defined as the time between reporting of the cases. The spatial distance is defined as the Euclidean distance between the geographic locations of cases. The genetic distance is defined as the Hamming distance between the sequenced isolates. The grey histograms show the observed pairwise distances between any two cases reported in Bangui. The solid black lines show the input distribution of distances between a case and its closest observed ancestor, given an assumed reporting rate of 20% (see S1 Text for sensitivity analyses to this assumption). Distributions have been rescaled to fit on the same graph as the histograms. The red vertical lines show the cutoffs corresponding to the 95% quantiles of these distributions. For a given data stream and a given choice of cutoff, pairs of cases with observed distance above the cutoff are considered not connected, and the corresponding graph edges are removed at the pruning step (see Fig 1).

