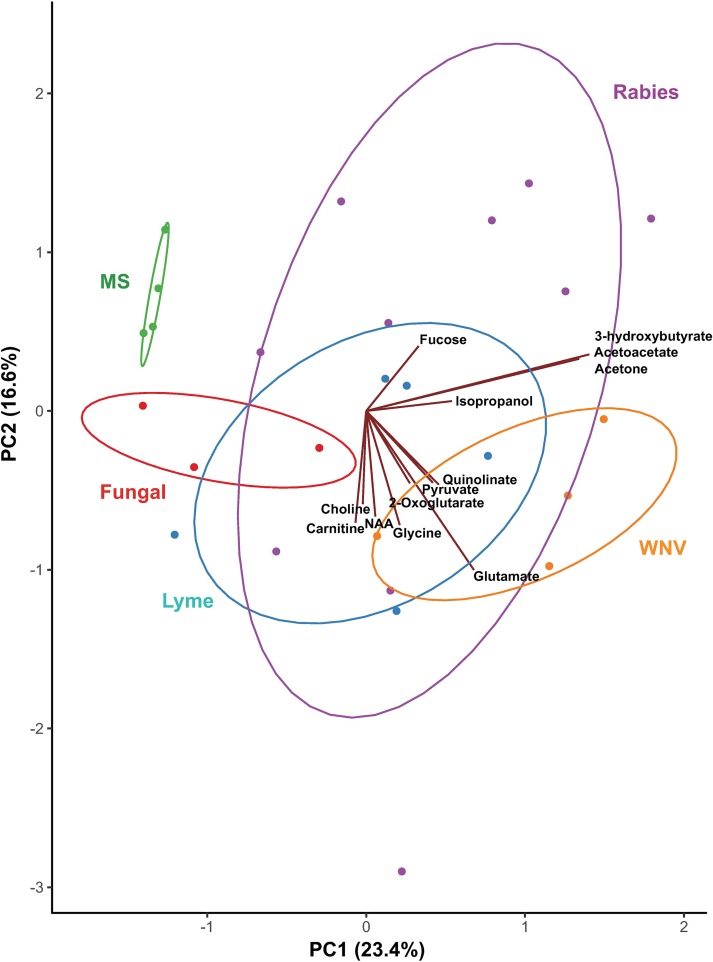
Fig 2. Principal component analysis of 1H-NMR CSF metabolomic data comparing neurological diseases.
Samples were collected from patients with multiple sclerosis (MS, represented in green), fungal infection (red), Lyme disease (blue), West Nile virus (WNV, orange), and rabies (purple). Normal data ellipses are shown for each group. Axes represent principal component (PC) scores. The percent of the variation explained by each component is given in parentheses. Vectors represent loadings of select metabolites with PC1 and PC2, as drawn in the Gabriel’s biplot. Groups of vectors that point in similar directions tend to change together. One extreme observation was excluded.

