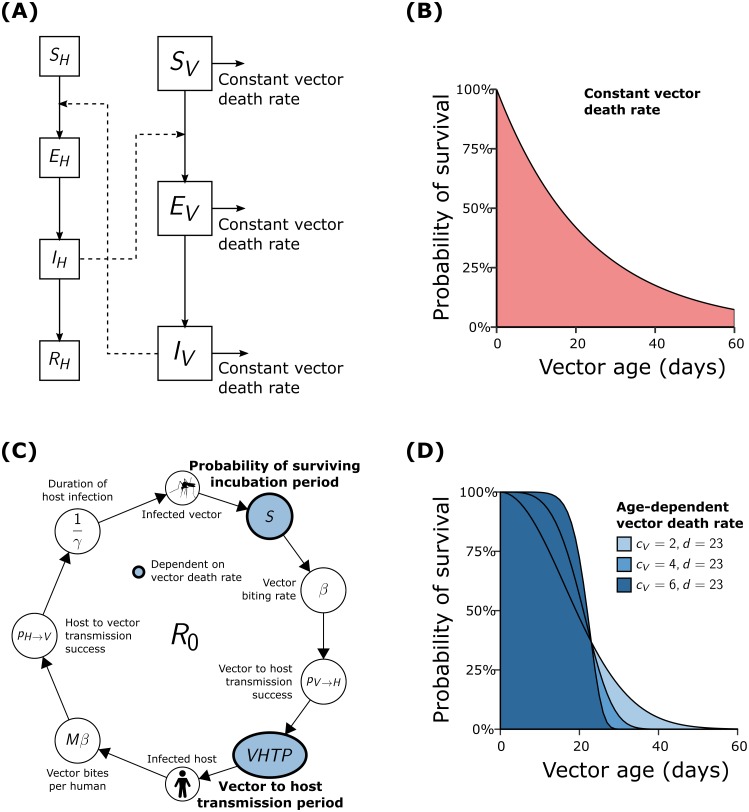
Fig 1. Comparison of flow diagrams and vector death rates between the ODE and IBM frameworks.
(A) The compartmentalised system of differential equations for a vector-borne pathogen assumes constant vector mortality rates from each state of infection. (B) Constant vector mortality rates result in exponential age distribution of vectors (with 1/μV = 21.3), with a high proportion of individuals living far beyond their life-expectancy. (C) The transmission cycle of a vector-borne pathogen used in the individual-based model highlighting the dependency of the infectious period and the probability of surviving the extrinsic incubation period on the mortality rate of vectors. (D) The age distribution of vectors under three different Weibull distributed mortality risks with an increasing dependency on vector age (light blue to dark blue with cV = 2, 4, 6 and dV = 23).

