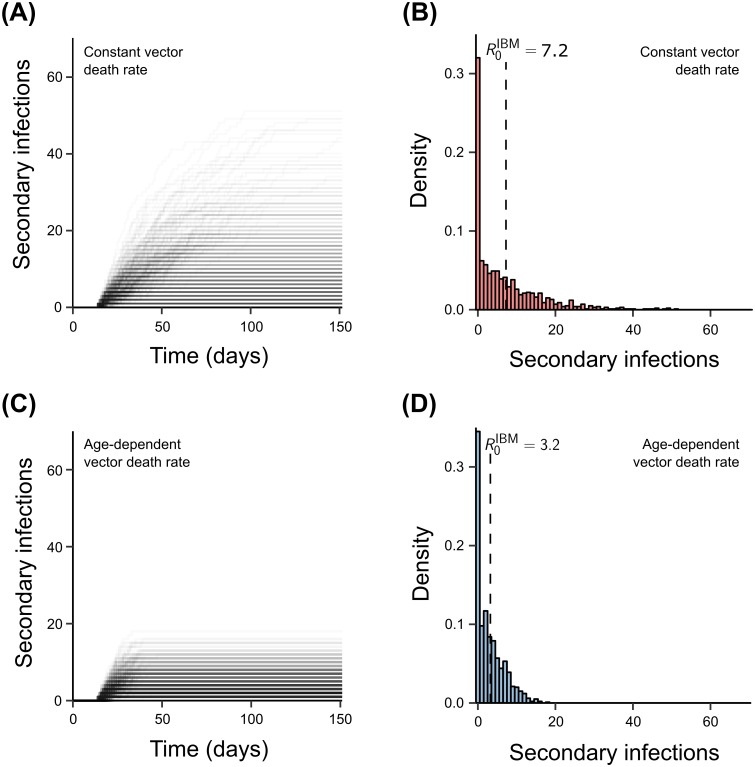
Fig 3. Reproductive number measured from the individual-based model.
(A,C) Keeping track of the number of secondary infections in an entirely susceptible population starting with a single human case over time illustrates how in the model with constant vector death rates, secondary cases can still occur more than 100 days after the disease is introduced. This is in stark contrast to the model with age-dependent mortality, where most secondary infections occur within the average life-expectancy of the mosquito. Each solid line represents the accumulation pathway of secondary infections over time with darkness indicating the percentage of simulations that follow each pathway. The individual-based model was executed 500 times yielding a distribution of total number of secondary infections, or R0, assuming either constant (B) or age-dependent vector mortality rates (D). The two dotted lines are the reproduction numbers calculated from the theoretical IBM calculation. The mean number of secondary infections was comparable to the reproduction number derived from the transmission cycle of a vector-borne pathogen. Results are based on 500 model runs. Parameter values as in Table 1, except cv = 1, dv = 20.8 (constant mortality) and cv = 4, dv = 23 (age-dependent mortality).

