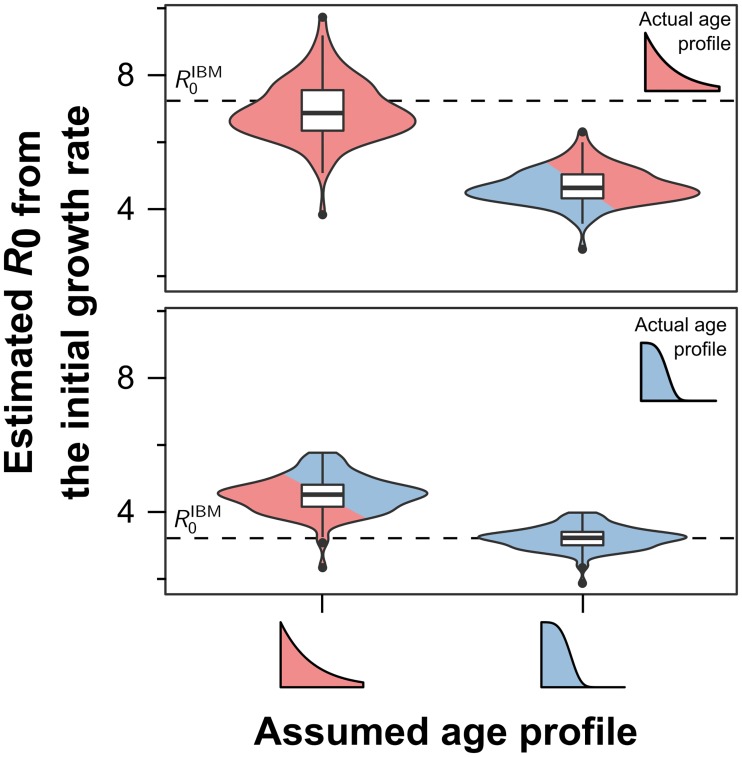
Fig 4. R0 estimates based on the initial growth can over-estimate R0.
Violin plots showing the density distribution of R0 estimates based on the initial epidemic growth rates. When the model assumptions regarding vector mortality correctly reflect the true mortality rates (solid colour) we find that the method based on epidemic growth generates fairly robust estimates of the true R0. When the assumed mortality rate does not coincide with the real one (mixed colour), estimates can be off by a wide margin. Results are based on 100 model runs for each scenario; the inserted boxplots indicate the median and interquartile ranges.

