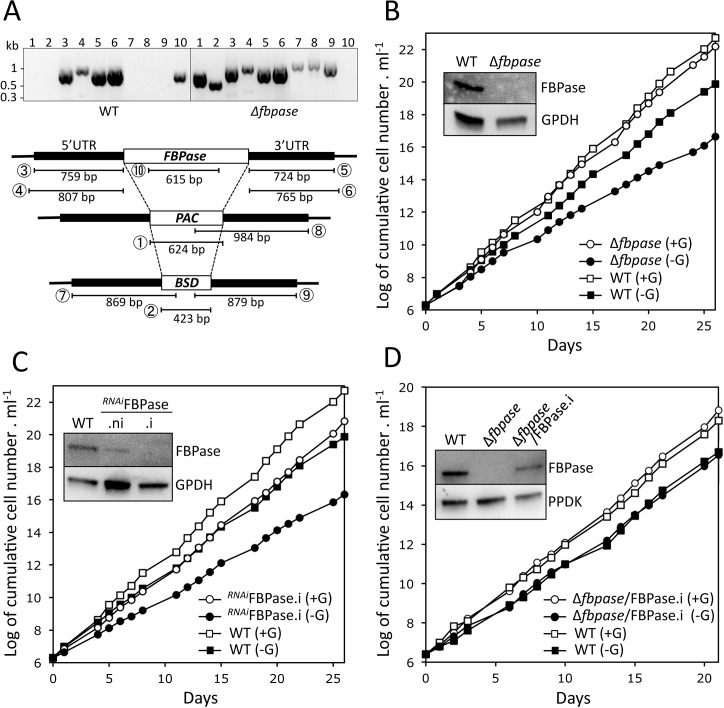
Fig 5. Analysis of FBPase mutants cell lines.
Panel A shows a PCR analysis of genomic DNA isolated from the parental (WT) and Δfbpase cell lines. The 1 to 10 lanes of the gel picture correspond to different PCR products described in the lower panel with circled numbers. As expected, PCR amplification of the FBPase gene (lane 10) was only observed in the parental cell line, while BSD and PAC PCR-products were observed only in the Δfbpase mutant (lanes 1–2 and 7–9). As control, both the 5'- and 3'-untranslated regions (UTRs) are PCR amplified from the parental and Δfbpase samples (lanes 3–6). Panels B-D show the growth curves of the Δfbpase (B), RNAiFPBase.i (C) and Δfbpase/FPBase.i (D) mutant cell lines, together with the parental (WT) cell line, incubated in SDM79-GlcFree medium containing 10 mM glucose (+G) or not (-G). Western blot analyses with the immune sera indicated in the right margin of the parental (WT), Δfbpase, the tetracycline-induced (.i) and non-induced (.ni) RNAiFPBase and/or Δfbpase/FPBase.i mutant are shown in the insets.

