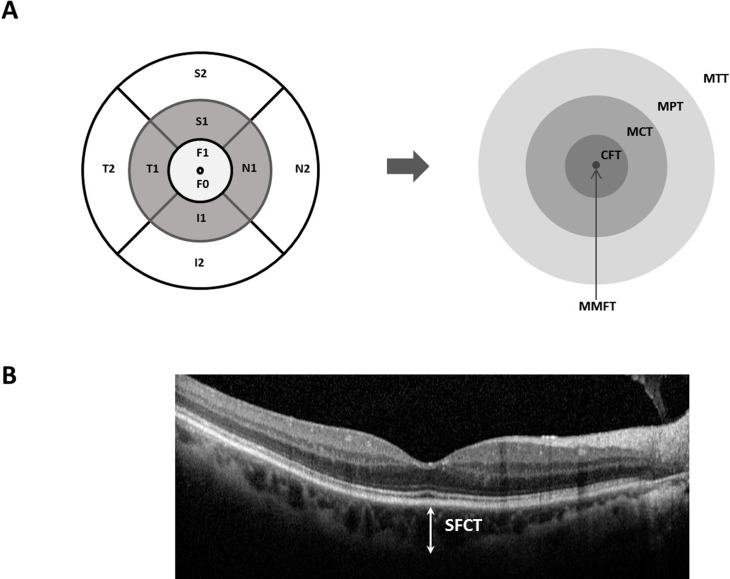
Fig 2. Diagram of the retinal and choroidal thickness measurement areas obtained with SD-OCT (EDI) System.
A, Diagram of the macular areas on the SD-OCT scan. The 9 standard ETDRS regions are converted into areas of interest, i.e. MMFT, CFT, MCT, MPT, MTT. Each ring, centered on the fovea, has a diameter of 6, 3, 1 millimeters, respectively. MMFT = mean minimal foveolar thickness = F0; CFT = central foveolar thickness = F1, MCT = mean central thickness = (S1+N1+I1+T1) / 4; MPT = mean peripheral thickness = (S2+N2+I2+T2) / 4; MTT = mean total region thickness = (F1+ S1~T1 + S2~T2) / 9; S = superior; I = inferior; N = nasal; T = temporal; ETDRS = Early Treatment Diabetic Retinopathy Study. B. Representative EDI image used in measuring SFCT. SFCT = subfoveal choroidal thickness.

