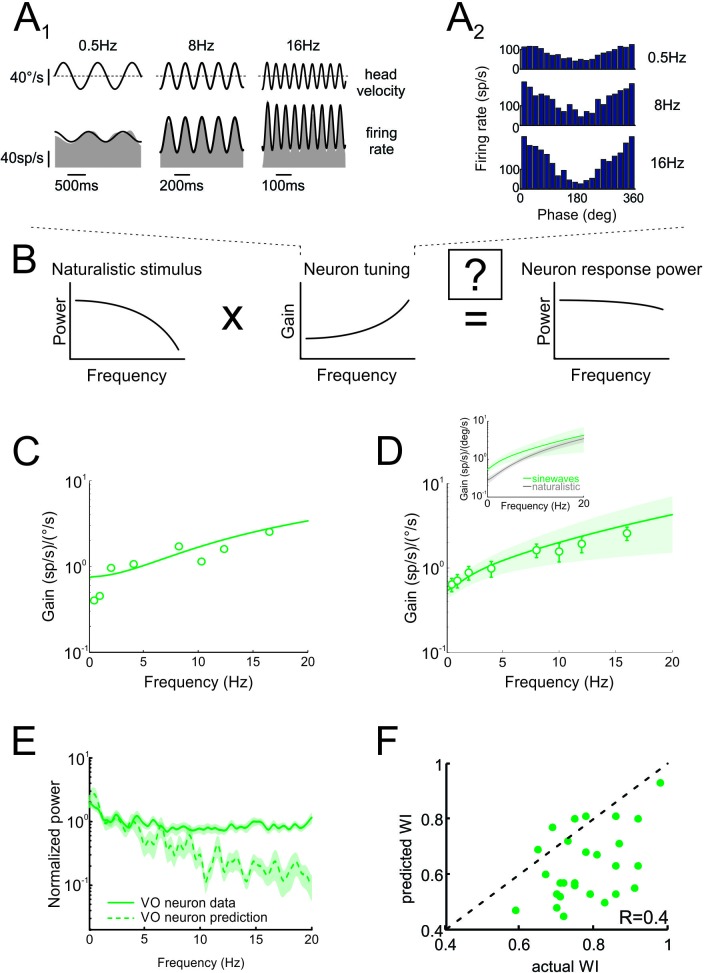
Figure 5. Neural tuning to artificial sinusoidal stimulation does not account for responses of central vestibular neurons to natural stimuli.
(A1) Response of example central vestibular neuron to sinusoidal yaw rotations with frequencies 0.5, 8 and 16 Hz. (A2) Post-stimulus time histogram (PSTH) of this example central vestibular neuron to sinusoidal yaw rotations with frequencies 0.5, 8 and 16 Hz. (B) Schematic showing how the response to a natural stimulus (right) is assumed to be determined from the stimulus spectrum (left) and the neural tuning function (middle). (C) Gain as a function of frequency for an example central vestibular neuron with best fit (solid line). (D) Population-averaged gain as a function of frequency. The solid line is the best fit with bands showing ±1 SEM. (E) Normalized power spectra of neural responses (solid green) and predictions (dashed green) for central vestibular neurons. Inset: Population-averaged tuning curves obtained using naturalistic (gray) and sinusoidal (green) stimulation. Note that the tuning obtained using naturalistic stimulation was lower than that obtained using sinusoidal stimulation at low frequencies, consistent with the fact that central vestibular neurons display a boosting nonlinearity (Massot et al., 2012). (F) Predicted versus actual whitening indices.

