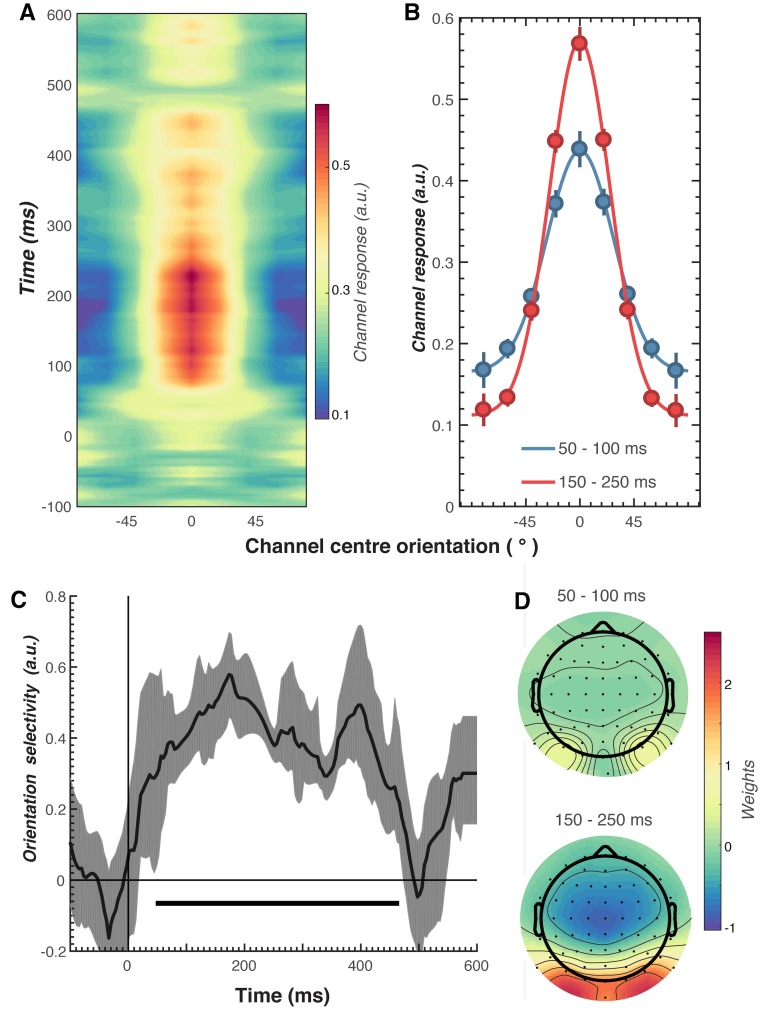
Figure 3. Results of the forward encoding modelling for orientation-selectivity.
(A) Time-resolved orientation tuning curve across all participants and conditions in response to the second Gabor in the pair. The forward encoding approach resulted in a tuning curve for each of the nine presented orientations. These tuning curves were then centred at each presented orientation (here labelled as 0°) to combine across all orientations. The orientation-selective response is contained within the overall pattern of EEG; activity begins soon after stimulus onset and peaks at around 250 ms before declining. (B) Population tuning curve of the stimulus reconstruction across participants, averaged between 50–100 ms and 150–250 ms after stimulus presentation. Each line is a fitted Gaussian response with a variable offset used to quantify orientation selectivity. Error bars indicate ±1 standard error of the mean across participants. (C) Amplitude of the channel response over time, averaged across all conditions (black line). The thick black line indicates significant encoding of stimulus orientation based on a cluster-permutation test across participants (cluster p < 0.05, N permutations = 20,000). Encoding accuracy was reliable from 52 to 470 ms post-stimulus onset. The error shading (in grey) indicates bootstrapped 95% confidence intervals of the mean. (D) Topographic plots of the weights (averaged across the nine orientation channels across all participants) derived from forward encoding at the corresponding time points shown in panel B. (a.u. = arbitrary units).

