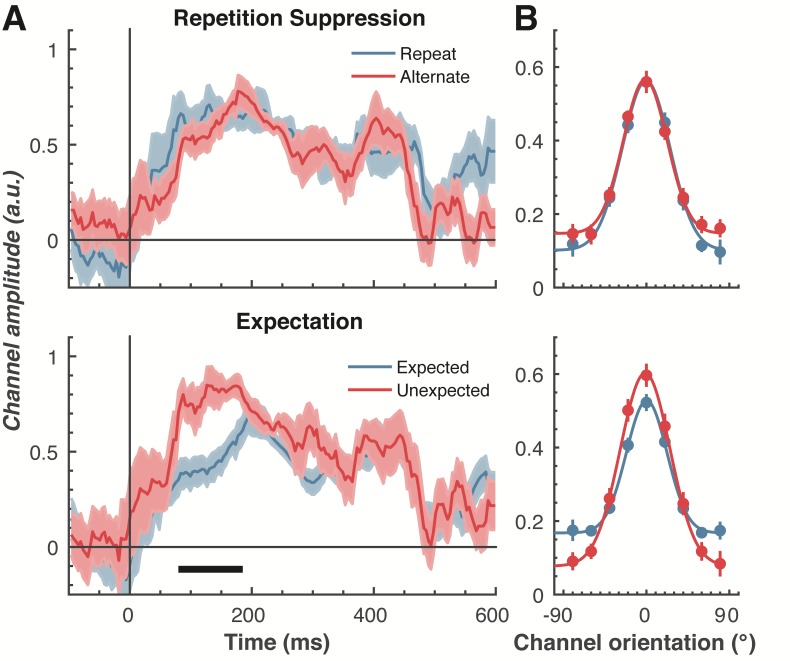
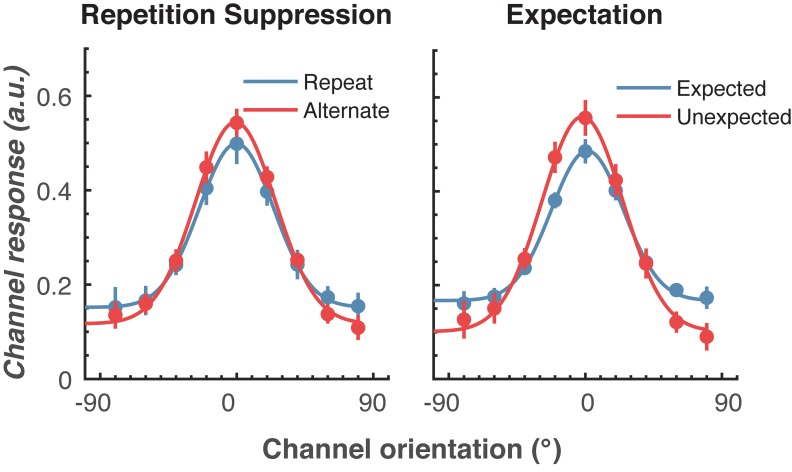
Figure 4. The effect of repetition suppression and expectation on orientation selectivity measured using forward encoding modelling.
(A) Amount of orientation-selective information (given by the amplitude of the fitted Gaussian) from the EEG signal in response to the second Gabor in a pair, shown separately for repetition suppression (upper panel) and expectation (lower panel). The thick black line indicates significant differences between the conditions (two-tailed cluster-permutation, alpha p < 0.05, cluster alpha p < 0.05, N permutations = 20,000). (B) Population tuning curves averaged over the significant time period (79–185 ms) depicted in panel A. The curves, shown as fitted Gaussians, illustrate how overall stimulus representations are affected by repetition and expectation. While there was no difference in orientation tuning for repeated versus alternate stimuli (upper panel), the amplitude of the orientation response increased significantly, and the baseline decreased, for unexpected relative to expected stimuli. Error bars indicate ±1 standard error.


