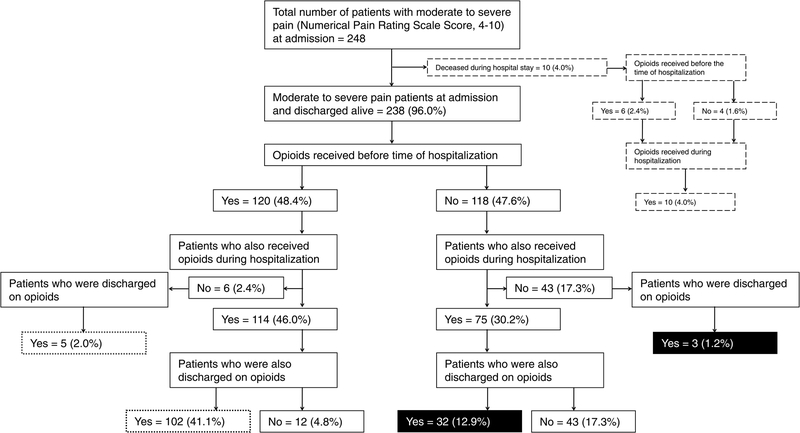
Figure 3:
Flow chart of opioid prescription before the time of hospitalization, during hospitalization, and at discharge. Percentages are calculated based on total study sample (N=248).  Received new prescription at discharge, inception cohort,
  Received prescription before the time of hospitalization and at the discharge, prevalent cohort,
  Deceased during hospital stay.

