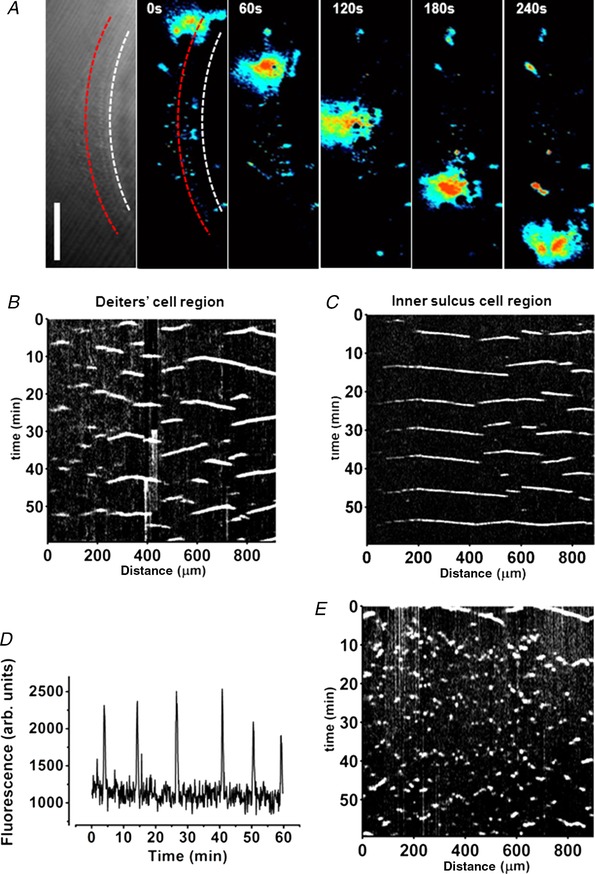
Figure 5. Slow Ca2+ waves in the adult organ of Corti.

A, transmitted light image of the in situ cochlea (leftmost panel). The tissue was loaded with OGB‐1AM. Spontaneous local Ca2+ rises propagated along the tissue. False colour (black, lowest Ca2+; red, highest Ca2+) background‐subtracted images indicating the change in cytoplasmic Ca2+. Fluorescence signal along a line (illustrated here in red) was collected for each frame to construct kymographs (see Methods). The red line depicted here is in the Deiters’ cell region; the white line follows the IS. Scale bar = 100 μm. B and C, kymographs for the Deiters’ cell region (B) and IS cell region (C). Black corresponds to the lowest fluorescence, white, the highest fluorescence. The measurement line was drawn along the line of each cell type. D, time course of fluorescence changes (arbitrary units) at a single ROI indicating the periodicity of slow Ca2+ waves. E, addition of the gap junction inhibitor 1‐octanol (1 mm) blocked slow Ca2+ wave propagation (reversible after washout, data not shown) resulting in Ca2+ signals in individual cells that did not spread.
