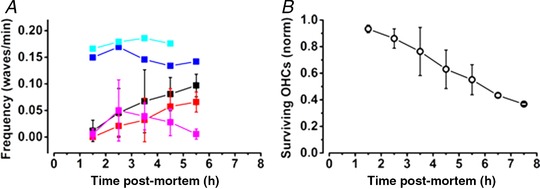
Figure 7. Slow Ca2+ wave signalling associated with progressive loss of OHCs.

A, frequency of slow Ca2+ waves in the Deiters’ cell region (black) and in the IS regions (red). Measurements made in three cochleas with t = 0 signifying removal of the temporal bone. In contrast to the slow wave frequency, fast wave frequency (magenta) decreased after the first hour of observation reaching a peak within the first 2 h after death. When the cochlea was obviously damaged, waves could be observed occurring continuously at a faster rate of approximately one every 7 min. Two examples are shown (cyan and blue). B, progressive loss of OHCs as estimated from a count of the fluorescence intensity of the cell profiles over the same period. Thus, 50% of OHC profiles were still present 5 h after death.
