
Figure 2. Fibrotic alterations in kidneys of control, diabetic and renin‐angiotensin‐aldosterone system inhibitor treated diabetic rats.
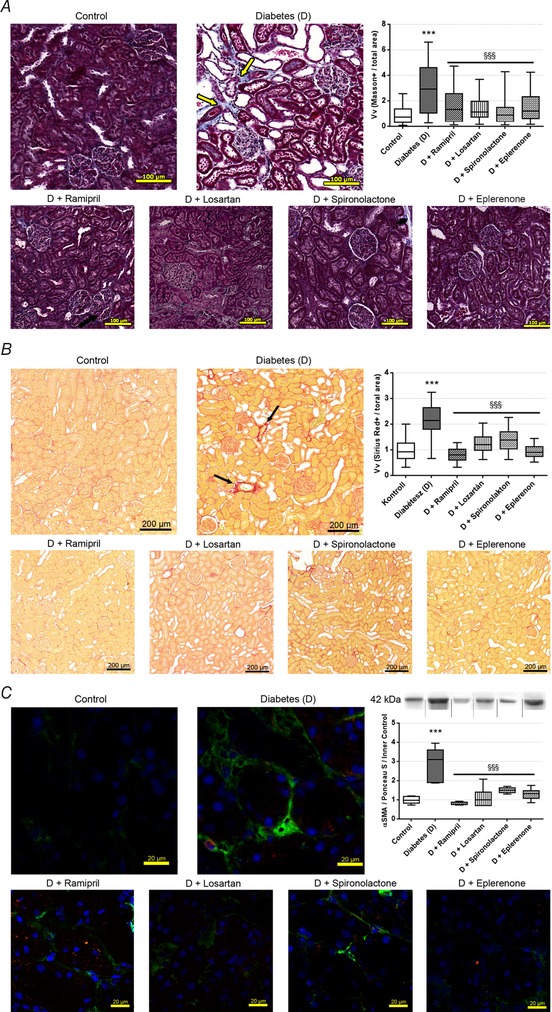
A, representative Massonʹs trichrome‐stained histological sections and quantitative evaluation of renal tubulointerstitial fibrosis by Masson‐positive and glomerulus‐free vs. total areas in the kidney cortex. Arrows mark fibrotic tissue stained with blue. 200× magnification; scale bar = 100 μm. B, representative Picrosirius Red‐stained histological kidney sections and quantitative evaluation of collagen accumulation. Arrows mark red‐stained collagen. 100× magnification; scale bar = 200 μm. On each graph values are presented as means ± 95% confidence intervals; n = 7–8 rats/group; Kruskal‐Wallis ANOVA on ranks; *** P < 0.001 vs. control; §§§ P < 0.001 vs. D. C, representative fluorescent immunohistochemical staining of renal sections and Western blot analysis of alpha‐smooth muscle actin (αSMA) protein levels in the kidneys, with representative examples above. Samples might be from different gels but were derived at the same time and processed in parallel. 630× magnification; green, αSMA; blue, nucleus; scale bar = 20 μm; values are presented as means ± 95% confidence intervals; n = 7–8 rats/group; one‐way ANOVA followed by Bonferroniʹs multiple‐comparison post hoc test; *** P < 0.001 vs. control; §§§ P < 0.001 vs. D.