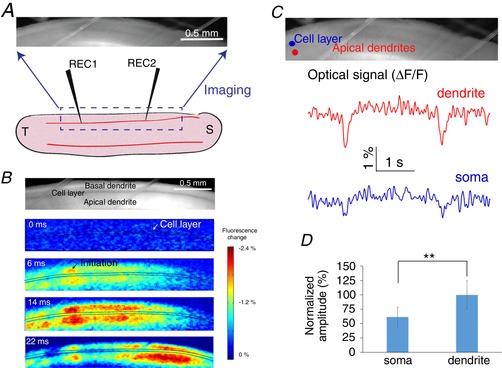
Figure 5. Transmembrane voltage imaging and the spatial–temporal features of the slow hippocampal periodic activity.

A, experimental set‐up for imaging experiments. B, imaging data show that the slow hippocampal oscillation propagates through the longitudinal hippocampus and the maximum power of the slow periodic activity was in the dendritic area. C, optical signals extracted from the cell layer and the apical dendrites show that the amplitudes are different between these two areas. D, dendritic membrane is significantly more depolarized than the somatic membrane: ** P < 0.01. [Color figure can be viewed at wileyonlinelibrary.com]
