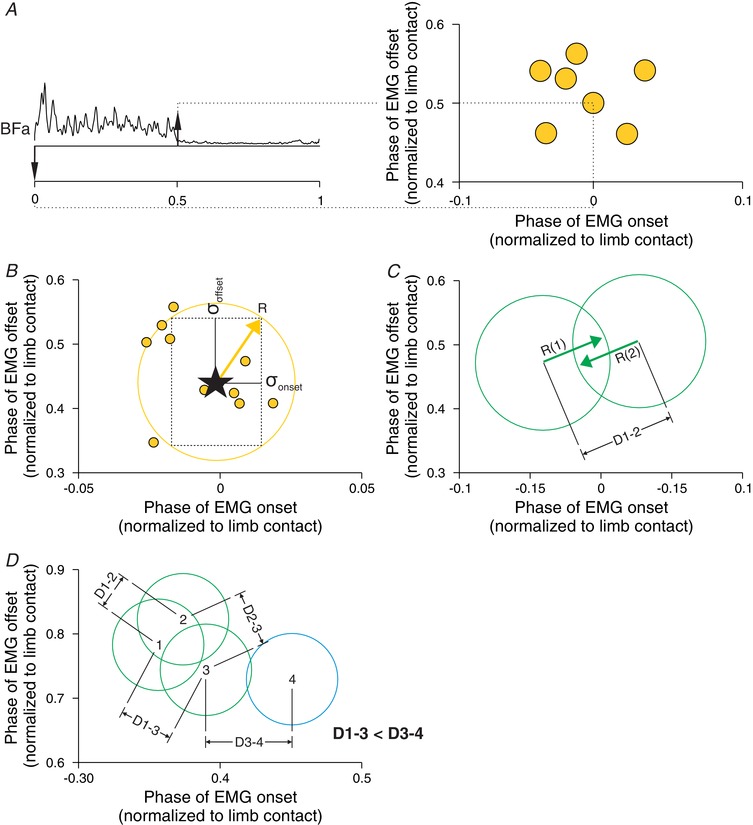
Figure 1. Characterization of muscle synergies with cluster analysis.

A, the onsets and offsets of individual EMG bursts were tagged manually (left panel) and represented on a scatterplot (right panel). B, for each muscle, the mean of the onsets and offsets was calculated (star) along with their standard deviations: σonset and σoffset. The radius (R) of the circle representing the cluster was measured as the square root of the sum of the square of σonset and of σoffset. C, we then calculated D, which is the distance between different clusters. D, to determine if different EMG bursts belong to the same synergy, we compared D between clusters.
