
Figure 3. Hindlimb muscle synergies during tied‐belt locomotion at 0.7 m s−1 in one spinal cat.
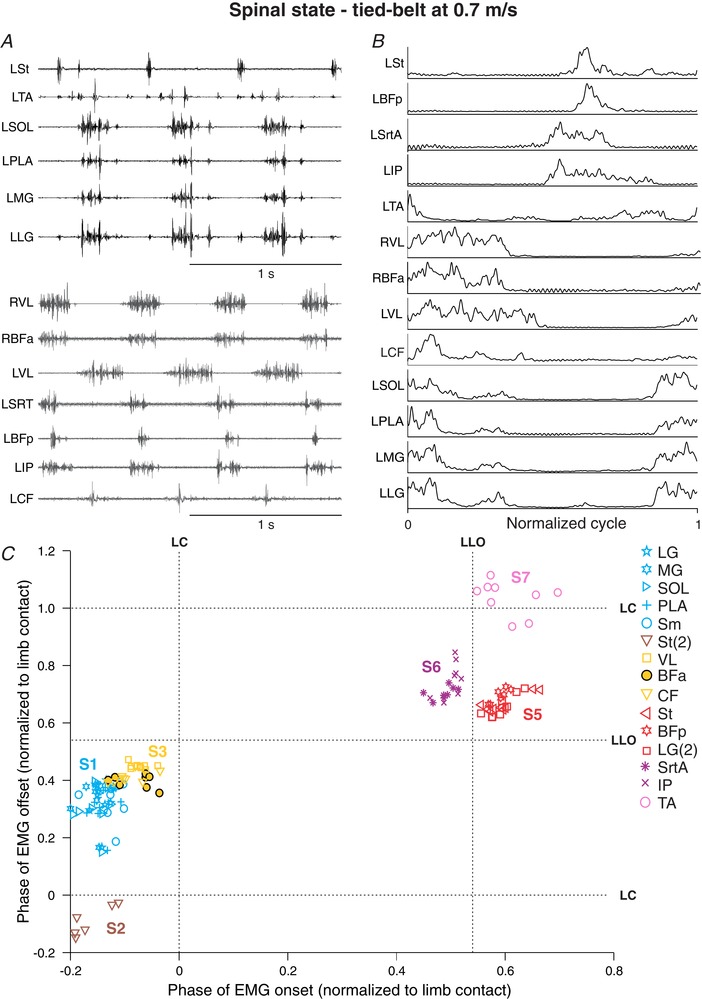
A, raw EMG waveforms obtained from 13 hindlimb muscles from two different locomotor episodes (black and grey EMGs). B, the EMGs were then averaged, rectified, and normalized to limb contact. C, the onsets and offsets of individual EMG bursts were measured and represented on a scatterplot. Each data point represents an EMG burst from one step cycle. The different muscle synergies (S1–S7) were determined by cluster analysis. Note that S4 is not present in this cat. For muscle abbreviations, see Table 1. Data are from Cat 5.