
Figure 8. Hindlimb muscle synergies during split‐belt locomotion at three different speeds of the fast limb in the intact and spinal states for the group.
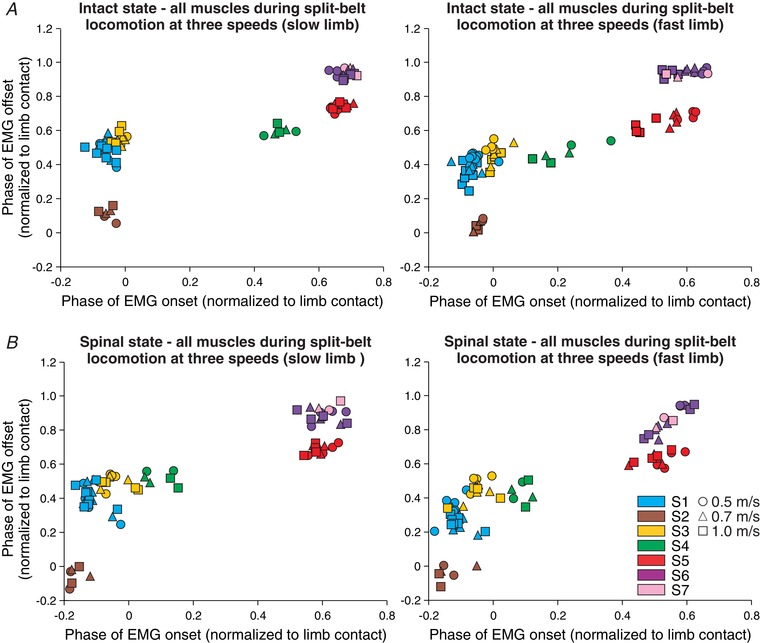
The seven hindlimb muscle synergies are shown at three different speeds of the fast limb in (A) the intact and (B) the spinal states. Each data point represents a different EMG burst. Different symbols (circles, triangles, squares) and colours represent different speeds and synergies, respectively. Each data point is the average from 2–7 cats.