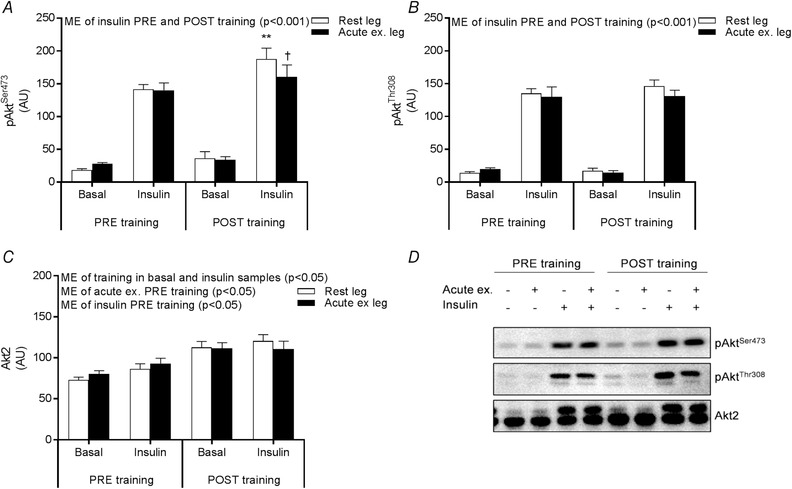
Figure 4. Phosphorylation and expression of Akt2.

Site‐specific phosphorylation of AktSer473 (A) and AktThr308 (B) and Akt2 protein expression (C) measured by Western blotting in the rested (white bars) and prior exercised leg (black bars) 4 h after acute one‐legged exercise (basal) and after a 2 h EHC (insulin) PRE and POST training. Representative blots (D). Data are expressed as the mean ± SEM. AU, arbitrary units; ME, main effect. ** P < 0.01 PRE vs. POST training; † P < 0.05, rested leg vs. acutely exercised leg.
