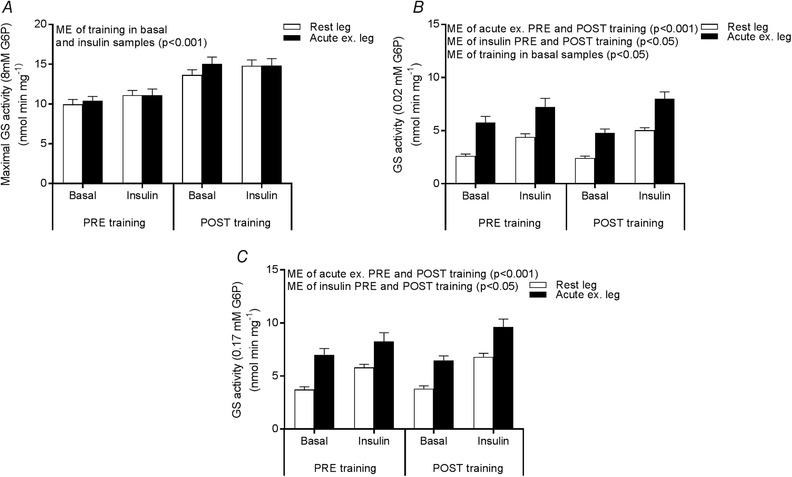
Figure 7. GS activity.

GS activity measured in the presence of 8 mm G6P (A) 0.02 mm G6P (B) and 0.17 mm G6P (C) in the rested (white bars) and prior exercised leg (black bars) 4 h after acute one‐legged exercise (basal) and after a 2 h EHC (insulin) PRE and POST training. Data are expressed as the mean ± SEM. ME, main effect.
