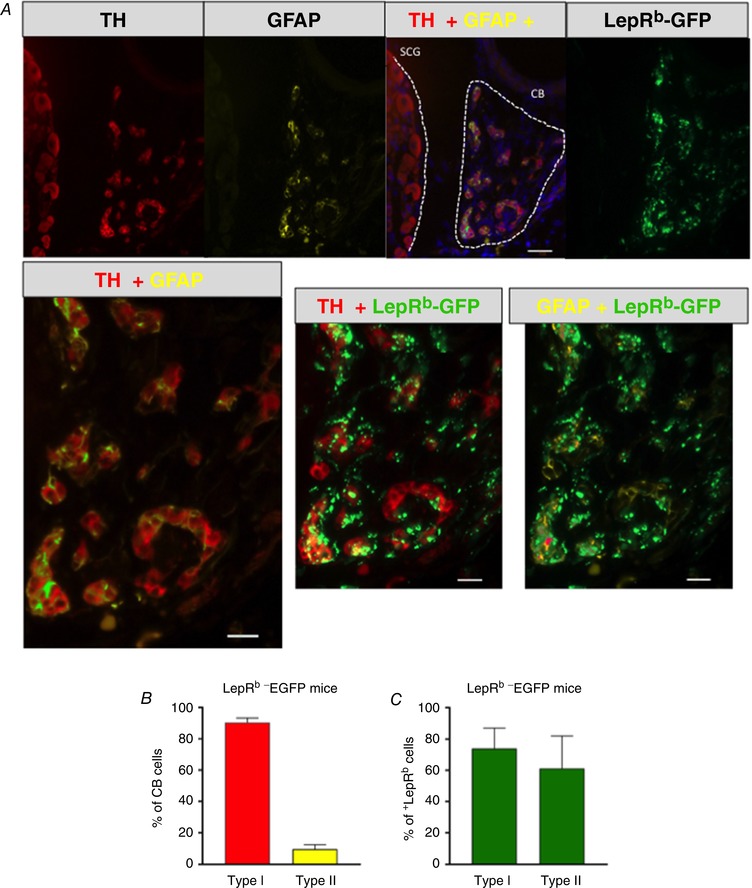
Figure 2. The long isoform of leptin receptor (LepRb) was expressed in tyrosine hydroxylase (TH)‐positive type I (glomus) cells and glial fibrillary acidic protein (GFAP)‐positive type II cells of the carotid bodies of LepRb‐EGFP mice.

A, co‐localization of TH (red), GFAP (yellow) and LepRb‐EGFP (green) in the carotid bodies (CB) and superior cervical ganglion (SCG). Upper panel: 20, scale bar = 20 μm; lower panel, 40×, scale bar = 50 μm. B, percentage of type I (TH‐positive cells) and type II (GFAP‐positive cells) cells in the carotid bodies. C, percentage of type I and type II cells expressing LepRb (n = 5).
